How Can We Help?
The matplotlib is an impressive data visualization library of python. Programmers can use this library to visualize the data, animations, etc. it is capable of plotting both 2D and 3D plots. Often this is used in economics, statistics, and business analysis.
What are Markers in Matplotlib? The markers are a way of representing the graph through different symbols. By default, it is either a simple line or points used to plot the graph. But the matplotlib allows many more marker types that we can use. Some include pixel circle, tr_up, line, tickdown, mathtext, etc.
In this article, we will learn how to plot different types of markers in the plot.
Matpltolib Marker List
| Marker | Meaning |
|---|---|
| ‘o’ | Circle |
| ‘*’ | Star |
| ‘.’ | Point |
| ‘,’ | Pixel |
| ‘x’ | X |
| ‘X’ | X (filled) |
| ‘+’ | Plus |
| ‘P’ | Plus (filled) |
| ‘s’ | Square |
| ‘D’ | Diamond |
| ‘d’ | Diamond (thin) |
| ‘p’ | Pentagon |
| ‘H’ | Hexagon |
| ‘h’ | Hexagon |
| ‘v’ | Triangle Down |
| ‘^’ | Triangle Up |
| ‘<‘ | Triangle Left |
| ‘>’ | Triangle Right |
| ‘1’ | Tri Down |
| ‘2’ | Tri Up |
| ‘3’ | Tri Left |
| ‘4’ | Tri Right |
| ‘|’ | Vline |
| ‘_’ | Hline |
Matpltolib Marker Shortcut String Notation (fmt)
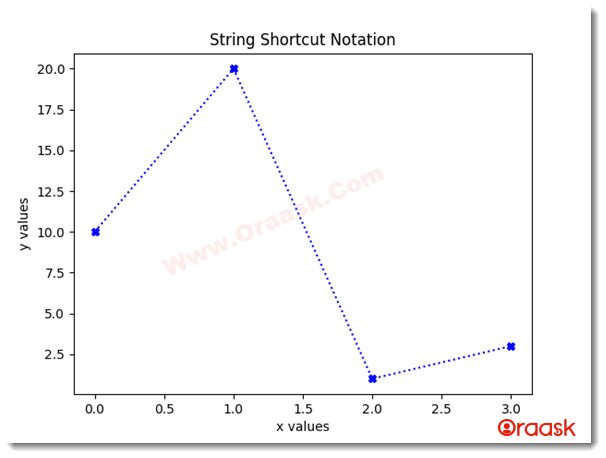
We can specify the marker parameter by using string shortcuts that are also called “fmt”
Syntax
marker|line|color
Example
#import all the necessary packages and libraries
import matplotlib.pyplot as plt
import numpy as np

ypoints = np.array([10, 20, 1, 3])
plt.plot(ypoints, 'X:b')
plt.xlabel("x values")
plt.ylabel("y values")
plt.title("String Shortcut Notation")
plt.show()
Output
Matplotlib Marker Size
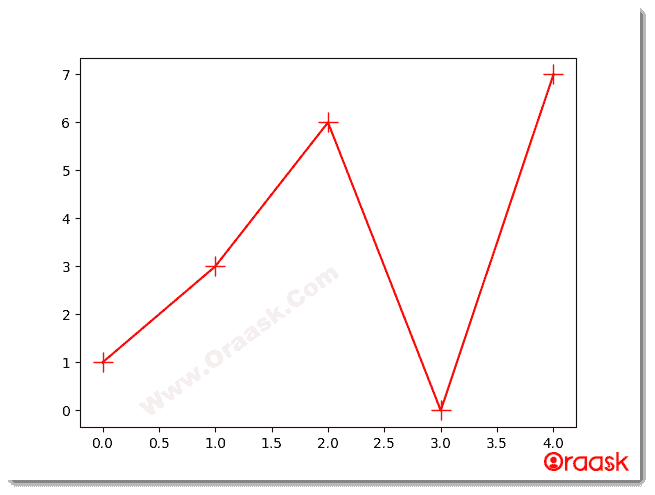
We have a parameter called “markersize” or the shorthand of it “ms” that we use to determine the size of the markers on our plot.
Example
#import all the necessary packages and libraries
import matplotlib.pyplot as plt
import numpy as np
ypoints = np.array([1, 3, 6, 0, 7])
plt.plot(ypoints, color = 'red', marker = '+', ms = 15)
plt.show()
Output
Explanation
- We first imported all the necessary libraries and modules into the code.
- Then we created a Numpy array called “ypoints” that contains a range of numbers that will be marked on our plot.
- Then in this step, we plot points and use our parameter “ms” to specify the marker size.
- The last line is to draw the plot and show it to the user.
Matplotlib Marker Color
There are two parameters available to colorize the matplotlib markers:
You may also be interested in checking this article: Python Matplotlib Colors
Matplotlib Marker Edge Color (mec)
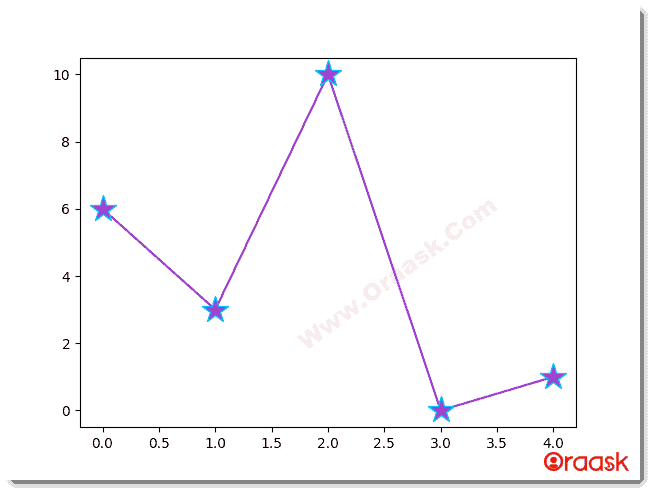
We have a parameter called “markeredgecolor” or the shorthand of it “mec” that we use to colorize the edge of the markers on our plot.
Example
#import all the necessary packages and libraries
import matplotlib.pyplot as plt
import numpy as np

ypoints = np.array([6, 3, 10, 0, 1])

plt.plot(ypoints, color = 'DarkOrchid', mec = 'DeepSkyBlue', marker = '*', ms = 20)
plt.show()
Output
Explanation
- We first imported all the necessary libraries and modules into the code.
- Then we created a Numpy array called “ypoints” that contains a range of numbers that will be marked on our plot.
- Then in this step, we plot points and use our parameter “mec” to specify the color of the edges of the markers on our plot.
- The last line is to draw the plot and show it to the user.
Matplotlib Marker Face Color (mfc)
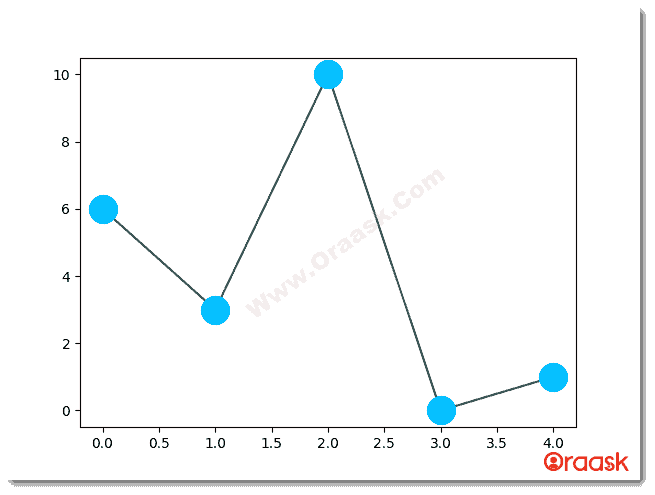
We have a parameter called “markerfacecolor” or the shorthand of it “mfc” that we use to colorize inside the edges of the markers on our plot.
Example
#import all the necessary packages and libraries
import matplotlib.pyplot as plt
import numpy as np

ypoints = np.array([6, 3, 10, 0, 1])

plt.plot(ypoints, color = 'DarkSlateGrey', mec = 'DeepSkyBlue', mfc = 'DeepSkyBlue', marker = 'o', ms = 20)
plt.show()
Output
Explanation
- We first imported all the necessary libraries and modules into the code.
- Then we created a Numpy array called “ypoints” that contains a range of numbers that will be marked on our plot.
- Then in this step, we plot points and use our parameter “mfc” to specify the color inside the edges of the markers on our plot.
- The last line is to draw the plot and show it to the user.
Note: We can use any of the 140 supported color names as well as using the Hexadecimal color values.
Matplotlib Marker Parameter List:
- Point
- Left triangle
- Right triangle
- Triangle up
- Triangle down
- Tri up
- Tri down
- octagon
- pentagon
- square
- star
- hexagon
- plus
- cross marker
- diamond
- horizontal line
- vertical line
- tick left
- tick right
- tick up
- tick down
Customizing the Matplotlib Markers
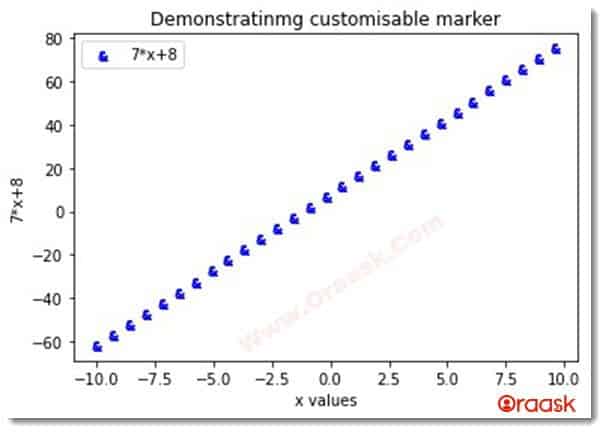
Matplotlib is so powerful that the user can use almost any kind of character as the marker class in the Python plot. We can do this by simply putting the character within two dollar signs.
marker parameter: “<marker><marker>”
Example
#import all the necessary packages and libraries
import matplotlib.pyplot as plt
import numpy as np
x=np.arange(-10,10,0.7)
y=7*x+8
plt.scatter(x,y,color="blue",marker="$&$")
plt.xlabel("x values")
plt.ylabel("7*x+8")
plt.legend(["7*x+8"])
plt.title("Demonstrating customisable marker")
plt.show()
Output
Conclusion:
In this article, we have learned about the different markers in matplotlib and how to use them. Users may not want the same conventional point marker. Sometimes they may want to use a different marker style. This is the reason why the marker attribute is present in the matplotlib. However, users mostly prefer to use the conventional point style default marker because that is much more professional and popular to use.


