How Can We Help?
Python is a compelling language that supports a wide variety of tasks. This is why it has gained tremendous attention in the last few years. The matplotlib is among the libraries of python, which is used for the data visualization-related task. Another significant library of python is the numpy library which stands for numerical python. As the name suggests, the library is used for performing a numerical-related task in python.
In this article, we will learn how to plot three-dimensional plots in python using the numpy array.
Frequently used Numpy Functions with Matplotlib
We can use the numpy library for creating data points and the matplotlib library for plotting those data points. We can create numpy arrays in several methods. We can create a list and then convert it into a numpy array using the numpy.array() function or directly create data points using the numpy functions.
Example (1)
import numpy as np
l=[1,4,5,732,4,3,32,4,7]
numpy_l=np.array(l)
print(numpy_l)
Output:
[ 1 4 5 732 4 3 32 4 7]
We can also directly create data points with the numpy library using numpy.arange() function. The numpy.arange() function takes three arguments.The syntax is as follows:
nump[y.arange(start,stop,step)Return value:
A numpy object
The first parameter defines the starting number for the iteration to take place. While the second parameter defines the last number up to which the iteration should occur. The last parameter defines the step for each iteration.
Example (2)
import numpy as np
a=np.arange(1,20,1)
print(a)
Output:
[ 1 2 3 4 5 6 7 8 9 10 11 12 13 14 15 16 17 18 19]
Another critical function of numpy is to use the random() function. We can create random numbers in numpy using the random() function.
Create 3D Scatter Plot using Matplotlib and Numpy Library
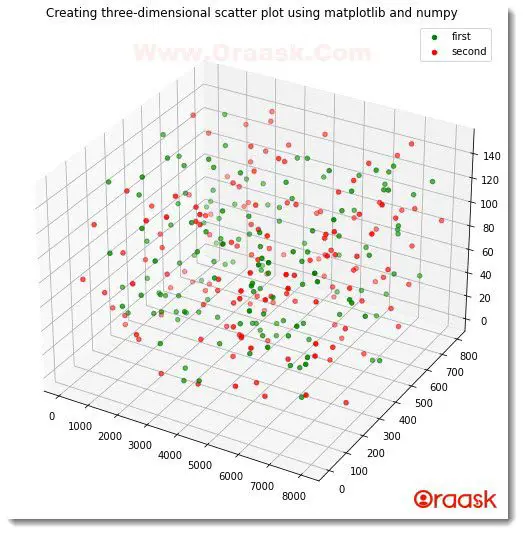
We can use the numpy array to create the data points and matplotlib to plot the data points in the plot. We need discrete data points to plot the scatter plots, which can be achieved by arange() function,linspace() function, etc.
Example (3)
#import all the necessary libraries
import numpy as np
import matplotlib.pyplot as plt

#defining a user-defined function to plot the three-dimensional scatter plot
def three_dimensional_scatter(x1,y1,z1,x2,y2,z2):
    #creating figure object in the plot
    fig = plt.figure(figsize = (9,9))
    #created three-dimensional workspace
    ax = plt.axes(projection ="3d")
    #plotting the first three-dimensional scatter plot using the parameters
    ax.scatter3D(x1, y1, z1, color = "green")
    #plotting the second three-dimensional scatter plot using the parameters
    ax.scatter3D(x2, y2, z2, color = "red")
    #defining title to the plot
    plt.title("Creating three-dimensional scatter plot using matplotlib and numpy")
    #defining legends to the plot
    plt.legend(["first","second"])
    #displaying the three-dimensional scatter plot
    plt.show()

#creating the main() function
def main():
    #creating data points for the z-axis
    z1 = np.arange(0,150,1)
    #creating data points for the x-axis
    x1 = np.random.randint(8000, size =(150))
    #creating data points for the y axis
    y1 = np.random.randint(800, size =(150))
    z2 = np.arange(0,150,1)
    #creating data points for the x-axis
    x2 = np.random.randint(8000, size =(150))
    #creating data points for the y axis
    y2 = np.random.randint(800, size =(150))
    #calling the main() function
    three_dimensional_scatter(x1,y1,z1,x2,y2,z2)

#declaring the main() function as the driving code of the program.
if __name__ == "__main__":
    main()
Output:

Check This: You might be interested in checking Matplotlib Scatter Plot if you want to know more about Scatter Plot.
Explanation:
- First, as customary, we imported all the necessary libraries and packages in our code. Imported numpy and matplotlib Library using the import statement of python.
- Next we created a user-defined function three_dimesnional_scatter(). This function takes 6 parameters namely x1,y1,z1,x2,y2,z2.Under this function, we created if-figure objects and specified the size of the figure. Next, we created an axes object using the plt.axes () function. We have passed the argument projection=”3d” to create a three-dimensional workspace.Next we plotted the graphs using ax.scatter3D() function.We passed the necessary parameters to the function. We also used another optional parameter, namely color. We used similar codes for plotting the second plot too.
- We also set the title to the plot using the plt.title() function. We set legends to the plot using the plt.legend() function. We then displayed the graph using the plt.show() function.
- Next, we created the main() function. Under this function, we created data points for both plots. We used both arange() function and random() functions of the numpy library for creating those data points.We called the three_dimensional_scatter() function.
- Finally, we called the main() function using the following lines of codes:
if __name__ == “__main__”:
main()
Create 3D Line Graphs using Numpy and Matplotlib library
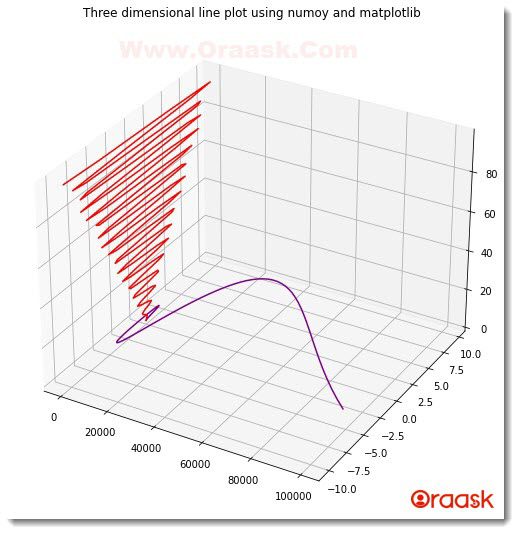
We can use the linspace() function of numpy to create continuous data points. This will be useful in plotting the line graph since the line graph is a continuous graph.
Example (4)
# importing mplot3d toolkits, numpy, and matplotlib
from mpl_toolkits import mplot3d
import numpy as np
import matplotlib.pyplot as plt

#creating a user-defined function line_2d()
def line_3d(x1,y1,z1,x2,y2,z2):
    #creating figure() object
    fig = plt.figure(figsize=(9,9))
    #creating axes() object
    ax = plt.axes(projection ='3d')
    #plotting the three-dimensional line plots
    ax.plot3D(x1, y1, z1, 'purple')
    ax.plot3D(x2, y2, z2, 'red')
    #defining the title of the plot
    ax.set_title('Three dimensional line plot using numpy and matplotlib')
    #displaying the plot
    plt.show()

#defining the main() function
def main():
    #creating the data points
    z1 = np.linspace(0, 10, 100)
    x1 =  np.power(z1,5)
    y1 = z1 * np.sin(z1)
    z2 = np.arange(0, 100, 1)
    x2 = z1 * np.sin(z2)*np.cos(z2)
    y2 = z1 * np.sin(z2)
    #calling the line_3d() function
    line_3d(x1,y1,z1,x2,y2,z2)

#calling the main() function
if __name__ == "__main__":
    main()
Output:

Check This: You might be interested in checking How to Plot 3D Line Graph in Matplotlib if you want to know more about 3D Line Charts.
Explanation:
- First, we imported all the necessary libraries and packages in our code using the import statement. We have imported the libraries using their alias names for convenience in writing our codes further.
- Next we created a user-defined function named line_3d() which takes six arguments namely x1,y1,z1,x2,y2,z2.Under this function, we first created the figure object and specified the size of the figure in our code using the figsize=”3d” attribute. Next, we plotted the plots using the plot3D(0 functions. We also specified color to the plots by using the color attribute.
- We also set the title to the plot and displayed the graph.
- Next, we created the main() function. This is the main driving code of the program. Under this function, we created data points for the axes for both plots. We used the linspace() function to generate continuous data points. We also used the power() function to plot the polynomial function.
- We then called the line_3d() function.Finally, we declared the main() function as the driving code of our program using the following lines of codes:
if __name__ == “__main__”:
main()
Plotting a Three-Dimensional (3D) Bar Chart using Numpy and Matplotlib
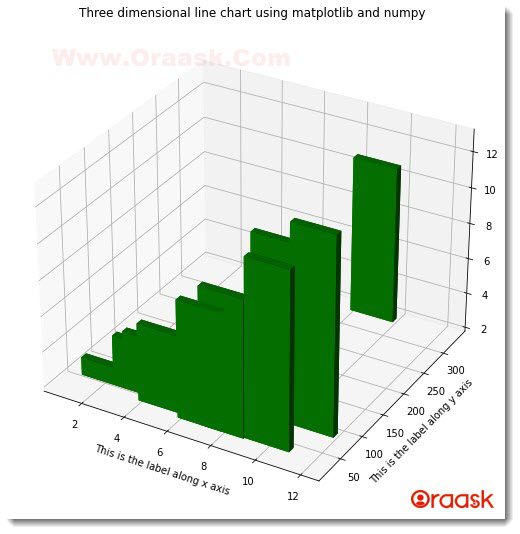
We can similarly use the numpy library to plot the bar chart in three dimensions. We can use all other attributes and functions associated with the two and three dimensions bar chart.
Example (5)
# import all the necessary libraries and modules
import numpy as np
import matplotlib.pyplot as plt

#creating a user-defined function named three_dimensional_bar()
def three_dimensional_bar(x,y,z,dx,dy,dz):
    # creating the figure class
    fig = plt.figure(figsize=(9,9))
    # creating the three-dimensional axes
    ax = plt.axes(projection="3d")
    #plotting the chart
    ax.bar3d(x, y, z, dx, dy, dz,color="green")
    #creating the label along the x-axis
    plt.xlabel("This is the label along the x-axis")
    #creating labels along the y axis
    plt.ylabel("This is the label along the y-axis")
    #creating title to the chart
    plt.title("Three-dimensional line chart using matplotlib and numpy")
    #displaying the graph
    plt.show()

#creating the main() function
def main():
    #passing value for the x-axis
    x3 = np.arange(1,11,1)
    #passing value for the y axis
    y3 =np.array([45,67,45,32,234,24,24,324,26,75])
    #passing value for the z-axis
    z3 = 2*np.ones(10)
    #setting the width along the x-axis
    dx =2*np.ones(10)
    #setting the width along the y axis
    dy = 10*np.ones(10)
    #setting the width along the z-axis
    dz = np.linspace(1,11,10)
    three_dimensional_bar(x3,y3,z3,dx,dy,dz)

# calling the main() function
if __name__ == "__main__":
    main()
Output:

Check This: You might be interested in checking Matplotlib 3D Bar Chart if you want to know more about 3D bar charts.
Explanation:
- First, we imported numpy and matplotlib library in the code using the import statement of python.
- Next we created a user-defined function called three_dimensional_bar() which takes three arguments namely x,y,z,dx,dy,dz.Under this function, we created a figure object using the figure() function of matplotlib. We have defined the size of the figure using the figsize attribute. Next, we created the axes class using the axes() function of matplotlib. We then plotted the bar graphs using the bar3d() function. We passed six necessary parameters to this function: x, y, z, dx, dy, and dz. The color attribute is optional in the function.
- We then created the labels along the x and y axis in the plot using the xlabel() and ylabel() functions; We also set the title to the plot using the title() function. Next, we displayed the graph using the plt.show() function.
- After the three_dimensional_bar() function, we created the main() function, which is the main driving code of the program. Under this function, using different types of functions available in the numpy library, we have generated the data points.
- Finally, we called the main() function by following lines of codes:
if __name__ == “__main__”:
main()
Final Words
In this article, we have discussed how to plot graphs using the matplotlib and numpy library.We have learnt about the important functions of the numpy library like arange(),linspace(),ones() etc.We also used many other functions and attributes associated.
Although we have covered the most important topics, it is recommended that the reader should look up python matplotlib documentation to have more information associated with the topic.


