How Can We Help?
Matplotlib is one of Python’s most important libraries, enabling programmers to plot graphs, animations, etc. The wireframe graph is the graph that accepts a grid of values and projects it into some specified three-dimensional surfaces. The wireframe graph can only be prepared in three-dimensional space and cannot be plotted in two dimensions.
Wireframe graphs are extensively used in dome architectures, monuments, building constructions, etc. These graphs give a very accurate and precise description of the dimensions and help determine the faults in architectural designs.
[adinserter block=”1″]
This article will discuss how to plot the wireframe graph in three dimensions.
Plotting a Simple Wireframe Graph
Plotting a three-dimensional wireframe graph in matplotlib is very simple. This can be done using the plot_wireframe() function of python matplotlib. The function takes three necessary arguments in the code. Other attributes like color cstride etc., are optional in the code. Note that the x, y, and z values should be either list or some array-like object. The z should be an array of two dimensions, but the x and y should only be an array of one dimension.
Example (1)
# Import all the necessary libraries and packages in the code
import matplotlib.pyplot  as plt
import numpy as np
# Make the wireframe plot
def wireframe( x , y , z ):
    # Creating the figure object
    fig = plt.figure(figsize = ( 9 , 9 ))
    # Creating the axes object
    ax = fig.add_subplot(111, projection = '3d')
    # Plotting the figure
    ax.plot_wireframe(x , y , z , rstride = 2 , cstride = 10, color = 'red')
    # Defining the title of the plot
    ax.set_title('Demonstrating wireframe graph')
    # Displaying the plot
    plt.show()
# Creating the main() function
def main():
    # Defining the data point for the x-axis
    x = np.linspace(1, 10 , 100)
    # Defining the data point for the y axis
    y = np.linspace(1 , 10 , 100)
    # Defining the data point for the z-axis
    z = np.outer(np.linspace(1 , 10 , 100), np.ones(100))
    # Calling the wireframe() function
    wireframe(x , y , z)
# Calling the main() function
if __name__ == '__main__':
    main()
[adinserter block=”2″]
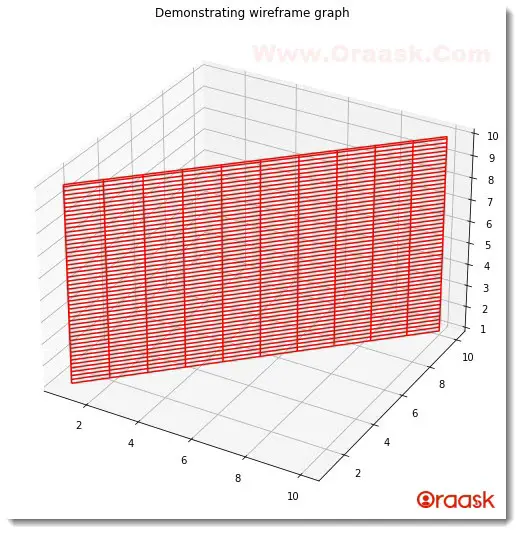
Output:

Explanation:
- First, we imported matplotlib.pyplot module and numpy library in the code using Python import statement. We have used the alias name of the libraries in the code for convenience in the program.
- Next, we created a user-defined function named wireframe, which takes three arguments: x, y, and z. Under this function, we first created the figure object using the figure () function of matplotlib.pyplot. We specified the size of the figure to ( 9,9 ). Next, we created the axes object using the add_subplot() function. Alternatively, we can also use the plt.axes() function to create the axes. The only difference is that the axes() function will create only one axes object, whereas the add_subplot() function will add multiple subplot axes in the figure.
- Next, we plotted the graph using the plot_wireframe() function. Under this function, we first passed all three parameters: x,y, and z. They are critical parameters in the function. Otherwise, Python will throw an error in the code. We also passed other arguments in the function like rstride, cstride, and color to the function. Next we set title to the graph using the plt.set_title() function. Now we have displayed the graph using the plt.show() function. However, in Jupyter Notebook, this is optional to use.
- After the wireframe () function, we created another function named the main () function. This is the driving code of the program. Under this function, we created the data points for the x, y, and z. We used the numpy array to create those data points in the code. We used np.outer() ,np.linspace() and np.onese() function in the code. The np.linspace() takes three arguments: start, end, and several elements. The start defines the starting number for the array to be created. The end defines the last number up to which the iteration should occur, and the last number defines the total number of uniformly spaced data points generated in the code. The np.ones() function generates arrays with 1 as the only element members. This function takes only one argument, which is an integer. This defines the number of elements that should be present in the array. The np.outer() function creates array-like object . It mainly takes two arguments in the code. The first is the one-dimensional array, and the second is another one-dimensional array. The result is an array of the same size as the second array.
- Finally, we called the wireframe () function. It is a void function; hence, it does not return anything. Next, we called the main () function using the following lines of codes:
if __name__ == ‘__main__’:
main ()
[adinserter block=”3″]
Creating Multiple Wireframe Graphs in the Same Plot
We can create multiple wireframe graphs in the exact figure using Python’s multiple plot_wireframe() function. We can use all the associated attributes with the functions.
Example (2)
# Import all the necessary libraries and packages in the code
import matplotlib.pyplot  as plt
import numpy as np
# Make the wireframe plot
def wireframe( x, y , z1, z2 ):
    # Creating the figure object
    fig = plt.figure(figsize = ( 9 , 9 ))
    # Creating the axes object
    ax = fig.add_subplot(111 , projection = '3d')
    # Plotting the first figure
    ax.plot_wireframe(x , y , z1 , rstride = 2 , cstride = 10, color = 'red')
    # Plotting the second figure
    ax.plot_wireframe(x , y , z2 , rstride = 2 , cstride = 10, color = 'green')
    # Defining the title of the plot
    ax.set_title('Demonstrating wireframe graph')
    # Displaying the plot
    plt.show()
# Creating the main() function
def main():
    # Defining the data point for the x-axis
    x = np.linspace(-100 , 100 , 100)
    # Defining the data point for the y axis
    y = np.linspace(-100 , 100 , 100)
    x1, y1 = np.meshgrid(x, y)
    # Defining the data points for the z-axis of the first figure
    z1 = np.outer(np.linspace(-100 , 100 , 100), np.ones(100))
    # Defining the data points for the z-axis of the first figure
    z2 =np.power(x1,2)+np.power(y1,2)
    # Calling the wireframe() function
    wireframe(x1 , y1 , z1, z2)
# Calling the main() function
if __name__ == '__main__':
    main()
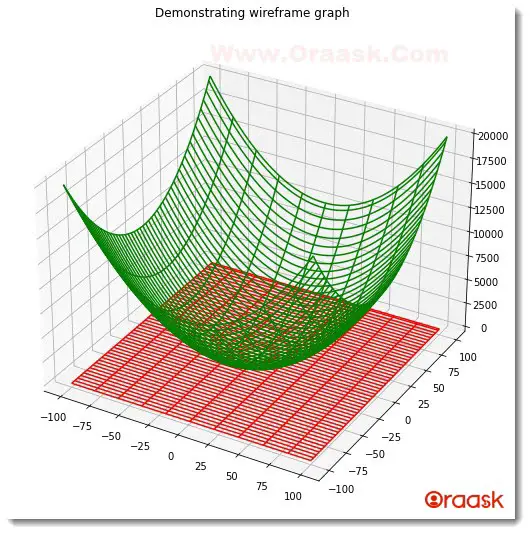
Output:
[adinserter block=”4″]

Explanation:
- First, we created all the necessary libraries and packages in the code. We imported matplotlib.pyplot module and numpy library using alias names. Next, we created a user-defined function named the wireframe () function. This function takes four arguments: x, y, z1, and z2.
- Under this function, we first created the figure() object. We specified the size of the figure using the figsize attribute. Next, we created a subplot in the code using the add_subplot() function. Under this function, we specified the attribute projection= “3d” to specify that we need a three-dimensional plot in the figure. Next, we used the plot_wireframe() function to plot the figure. For the first figure, we first passed the x,y, and z1 parameters, and for the second figure, we passed the x,y, and z2 parameters. Note that these parameters are necessary; otherwise, Python will throw an error while interpreting the code.
- We specified separate colors for the figures to distinguish them figures from one another.
- Next, we added a title to the graph using the set_title() function. We then displayed the graph using the plt.show() function.
- Now we created the main () function, which is the main driving code of the program. We created the data points for the x, y, and z-axis for both plots using the numpy arrays. We called the wireframe() function.
- Finally, we declared the main () function as the driving code using the following lines of codes:
if __name__ == ‘__main__’:
main ()
Check This: There is a full guide on Matplotlib 3D Bar Chart if you want to know more about 3D Charts.
[adinserter block=”5″]
More Examples on the Wireframe Graph
In this section, we will practice plotting the wireframe graphs from the functions.
Example (3)
Plot the function z = f( x , y )= x2 + y2
Code:
# Import all the necessary modules and functions in the code
import numpy as np
import matplotlib.pyplot as plt
# Create a user-defined function named surface()
def wireframe(x, y, z):
    # Next, create a figure object using the figure () function
    fig = plt.figure(figsize=( 9 , 9))
    # Creating the figure axes
    ax = plt.axes(projection = '3d')
    # Plotting the graph.
    surface_graph = ax.plot_wireframe(x, y, z ,color="yellow")
    # Defining the title of the plot
    plt.title("Wireframe graph")
    # Displaying the plot
    plt.show()
# Creating the main() function
def main():
    # Creating data points for the x-axis
    x = np.outer(np.linspace( -80 , 80 , 100 ), np.ones(100))
    # Creating data points for the y axis
    y = np.linspace(-80 , 80 , 100)
    # Creating data points for the z-axis
    z = np.power(x,2)+np.power(y,2)
    # Calling the wireframe() function
    wireframe(x , y, z)
# Calling the main() function
if __name__ == "__main__":
    main ()
Output:
[adinserter block=”6″]

Example (4)
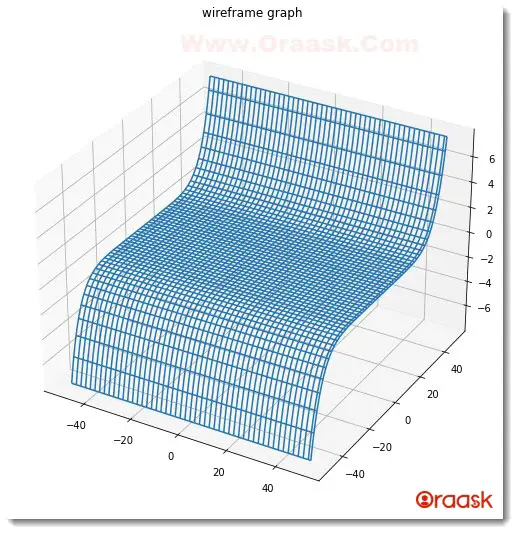
Plot the function z = f(x , y ) = x5 + y7
[adinserter block=”7″]
Code:
# Import all the necessary modules and functions in the code
import numpy as np
import matplotlib.pyplot as plt
# Create a user-defined function named wireframe()
def wireframe(x, y, z):
    # Next, create a figure object using the figure () function
    fig = plt.figure(figsize=(9, 9))
    # Creating the figure axes
    ax = plt.axes(projection='3d')
    # Plotting the graph.
    wireframe_graph = ax.plot_wireframe(x, y, z)
    # Defining the title of the plot
    plt.title("wireframe graph")
    # Displaying the plot
    plt.show()
# Creating the main () function
def main():
    # Creating data points for the x-axis
    x = np.outer(np.linspace(-50, 50, 100), np.ones(100))
    # Creating data points for the y axis
    y = np.linspace(-50, 50, 100)
    # Creating data points for the z-axis
    z = np.power(x, 5)+np.power(y, 7)
    # Calling the wireframe () function
    wireframe(x, y, z)
# Calling the main() function
if __name__ == "__main__":
    main ()
Output:

[adinserter block=”8″]
Example (5)
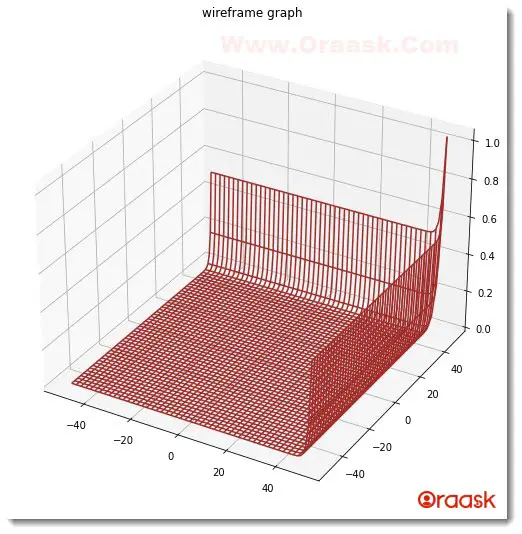
Plot the function z= f (x , y ) = ex+ ey
Code:
# Import all the necessary modules and functions in the code
import numpy as np
import matplotlib.pyplot as plt
# Create a user-defined function named wireframe()
def wireframe(x, y, z):
    # Next, create a figure object using the figure () function
    fig = plt.figure(figsize=(9, 9))
    # Creating the figure axes
    ax = plt.axes(projection='3d')
    # Plotting the graph.
    wireframe_graph = ax.plot_wireframe(x, y, z , color="brown")
    # Defining the title of the plot
    plt.title("wireframe graph")
    # Displaying the plot
    plt.show()
# Creating the main () function
def main():
    # Creating data points for the x-axis
    x = np.outer(np.linspace(-50, 50, 100), np.ones(100))
    # Creating data points for the y axis
    y = np.linspace(-50, 50, 100)
    # Creating data points for the z-axis
    z = np.exp(x)+np.exp(y)
    # Calling the wireframe () function
    wireframe(x, y, z)
# Calling the main() function
if __name__ == "__main__":
    main ()
Output:

[adinserter block=”9″]
Final Words
This article taught us how to plot the wireframe graph in three dimensions. We have learned that the plot_wireframe() function is used to plot the wireframe graph in Python. Besides the matplotlib library, we have also used the numpy library for creating the data points. We understood the usage of the np.linspace() ,np.ones() , np.outer() functions etc. in the codes.
This article has discussed most of the essential functions and associated attributes. After going through the article, we recommend the readers look up the python matplotlib library to understand the topics better.


