How Can We Help?
Introduction
In matplotlib, we can customize almost everything we can think of. The output of the pyplot module is a figure in some space. Most of the time, the user may need a bigger or more petite figure space for the visualization. In this article, we will understand how to change the x-axis and the y-axis limits in matplotlib.
Prerequisite
Before we proceed with the codes, we presume that the reader has sound knowledge of contour plots. We also need some libraries and packages to code. They are namely matplotlib and Numpy. In case you haven’t installed them, then perform the following:
If you are a windows user, then open the PowerShell and run the following commands:
pip install matplotlib numpyIf you are a Linux or a macOS user, then open the bash terminal and run the following commands:
pip install matplotlib numpyChanging The Limit Along The X-Axis
Changing the limits along the x-axis is easy. We only need to use a function of matplotlib named xlim(), and we need to pass the.
The function takes two significant arguments, left and right. The left and right simultaneously define the limit to the axes’ left and right.
Example (1)
# Import all the required libraries and modules in the code
import matplotlib.pyplot as plt
import numpy as np
# Creating a user-defined function named lim_change
def lim_change(x, y):
    # Creating the figure object
    fig = plt.figure(figsize=(9, 9))
    # Plotting the figure
    plt.plot(x,y, color='green')
    # Putting a limit on the x-axis
    plt.xlim(-20, 20)
    # Defining the title for the plot
    plt.title("Demonstrating the change of x and y axis limits ")
    # Displaying the plot
    plt.show()
# Creating the main() function
def main():
    # Creating the x coordinates of the data points
    x = np.arange(0, 10, 0.1)
    # Creating the y coordinates of the data points
    y = np.sin(x)
    # Calling the lim_change function
    lim_change(x, y)
# calling the main function
if __name__ == '__main__':
    main()
Output:

Explanation:
- First, we imported all the necessary libraries and packages in our code using the import statement of python. Next, we created a user-defined function named lim_change. The function is a void function and takes two arguments, namely x and y. Under the function, we first created the fig object using the figure function. We defined the size of the figure using the figsize attribute of pyplot.
- Next, we plotted the figure using the plot function of pyplot. We passed the values of x and y to this function. We also set the color to the plot using the color attribute of matplotlib. Next comes the most crucial part. We used the xlim function to set limits on the axes. We passed two arguments to the functions -20 and 20. -20 defines that we need the axes to extend up to -20 to the left side, and 20 indicates we want the x-axis to extend 20 to the right side.
- Using the title function, we set the title for the plot, and using the show function; we displayed the graph. However, this is optional to use in Jupyter Notebook.
- We created the main function next in the code. Under this function, we created x coordinates for the data points using the numpy library of python. The arrange function takes three arguments, namely start, stop and step. Start defines the number with which the iteration should start. The stop defines the number up to which the iteration should run, and the last parameter defines the step for the iterations to take place.
- We called the lim_change function with appropriate arguments to plot the graph. Finally, we used the following lines of codes to call the main function:
if __name__ == ‘__main__’:
main()
Check This: if you are interested in checking How to Remove the Top, Left, Right, and Bottom Axis in Matplotlib.
Changing The Limit Along The Y Axis:
Just like we have changed the limits along the x-axis, matplotlib also allows us to change the limit along the y-axis. We can use the ylim function to achieve the same along the y-axis.
Example (2)
# Import all the required libraries and modules in the code
import matplotlib.pyplot as plt
import numpy as np
# Creating a user-defined function named lim_change
def lim_change(x, y):
    # Creating the figure object
    fig = plt.figure(figsize=(9, 9))
    # Plotting the figure
    plt.plot(x,y, color='red')
    # Putting a limit on the x-axis
    plt.ylim(-0.85, 0.85)
    # Defining the title for the plot
    plt.title("Demonstrating the change of x and y axis limits ")
    # Displaying the plot
    plt.show()
# Creating the main() function
def main():
    # Creating the x coordinates of the data points
    x = np.arange(0, 10, 0.1)
    # Creating the y coordinates of the data points
    y = np.cos(x)
    # Calling the lim_change function
    lim_change(x, y)
# calling the main function
if __name__ == '__main__':
    main()
Output:
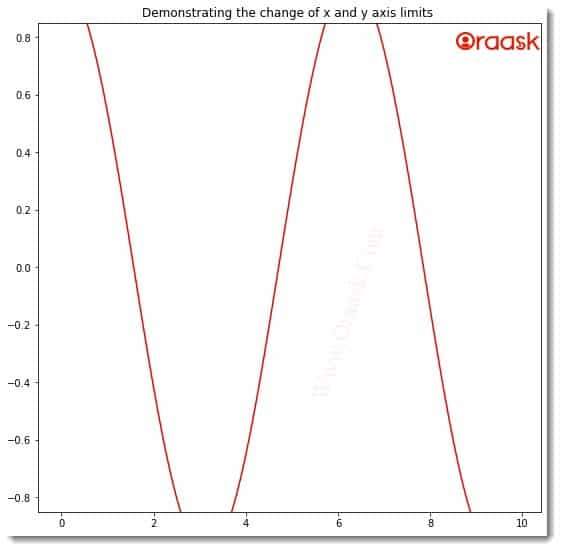
We know that the value of the cosine function always lies between -1 and 1. However, we have set limits along the axes. We have only taken the values between -0.85 and 0.85, and hence some of the portions got trimmed off from the figure.
If you pass only one parameter to the function, then it will be considered for the left-hand limit by default.
Example (3)
# Import all the required libraries and modules in the code
import matplotlib.pyplot as plt
import numpy as np
# Creating a user-defined  function named lim_change
def lim_change(x, y):
    # Creating the figure object
    fig = plt.figure(figsize=(9, 9))
    # Plotting the figure
    plt.plot(x,y, color='purple')
    # Putting a limit on the x-axis
    plt.xlim(2)
    # Defining the title for the plot
    plt.title("Demonstrating the change of x and y axis limits ")
    # Displaying the plot
    plt.show()
# Creating the main() function
def main():
    # Creating the x coordinates of the data points
    x = np.arange(0, 10, 0.1)
    # Creating the y coordinates of the data points
    y = np.exp(x)
    # Calling the lim_change function
    lim_change(x, y)
# calling the main function
if __name__ == '__main__':
    main()
Output:
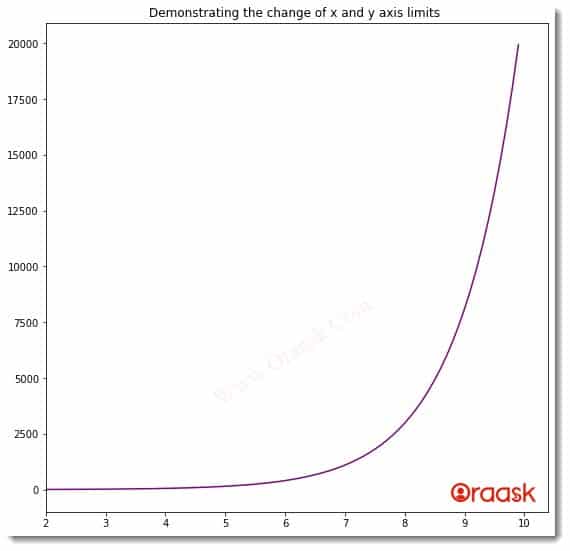
Notice that by default, python took the left-hand side limit. But what if we want to have limits only to the right-hand side?
Python allows us to do so through the left and right attributes.
Example (4)
# Import all the required libraries and modules in the code
import matplotlib.pyplot as plt
import numpy as np
# Creating a user define a function named lim_change


def lim_change(x, y):
    # Creating the figure object
    fig = plt.figure(figsize=(9, 9))
    # Plotting the figure
    plt.plot(x,y, color='purple')
    # Putting a limit on the x-axis
    plt.xlim(right=5)
    # Defining the title for the plot
    plt.title("Demonstrating the change of x and y axis limits ")
    # Displaying the plot
    plt.show()
# Creating the main() function
def main():
    # Creating the x coordinates of the data points
    x = np.arange(0, 10, 0.1)
    # Creating the y coordinates of the data points
    y = np.power(x,3)
    # Calling the lim_change function
    lim_change(x, y)
# calling the main function
if __name__ == '__main__':
    main()
Output:
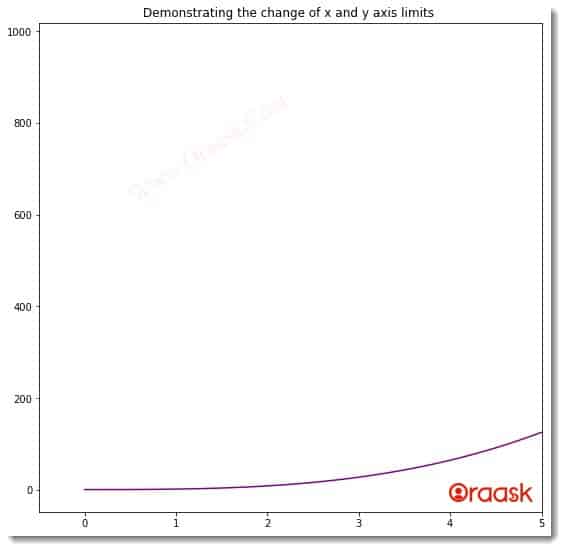
However, you can try both the axes’ left and right-side limits using the same technique in the figure.
What if we set the left-hand side limit more than the right-hand side limit? A possible answer that should come to our mind is that python will give an error. However, python does not give any error. It simply reverses the axes in such a situation. The xlim and the ylim function create a list that may not be in the domain of the plot too. In such a situation, python won’t show any error, but nothing will be present in the figure area.
Example (5)
# Import all the required libraries and modules in the code
import matplotlib.pyplot as plt
import numpy as np
# Creating a user define a function named lim_change


def lim_change(x, y):
    # Creating the figure object
    fig = plt.figure(figsize=(9, 9))
    # Plotting the figure
    plt.plot(x,y, color='purple')
    # Putting a limit on the x-axis
    plt.xlim(left =50,right=60)
    # Defining the title for the plot
    plt.title("Demonstrating the change of x and y axis limits ")
    # Displaying the plot
    plt.show()
# Creating the main() function
def main():
    # Creating the x coordinates of the data points
    x = np.arange(0, 10, 0.1)
    # Creating the y coordinates of the data points
    y = np.power(x,3)
    # Calling the lim_change function
    lim_change(x, y)
# calling the main function
if __name__ == '__main__':
    main()
Output:
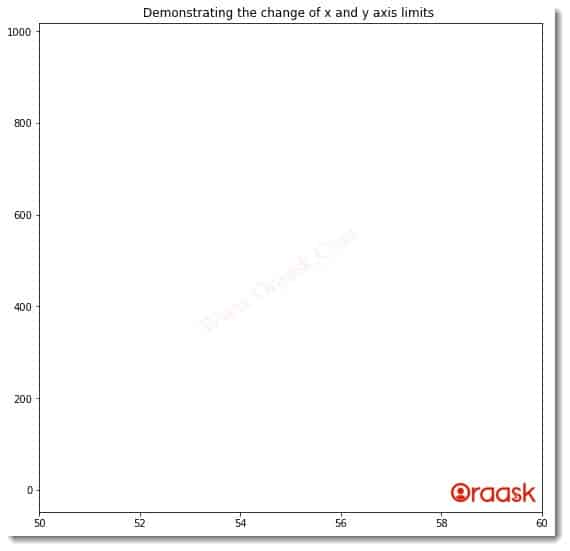
In the above code, we have the domain in the range[0,10) but using the xlim; we are trying to see the corresponding in the domain [50,60). Since this is not a domain of our original function, we are plotting; hence we do not get any graph.
Setting x and y limits using the axes objects
We may not always choose the plt.plot function to plot our graph. Sometimes we may choose to use the axes() function to plot our graphs as it allows us to plot multiple plots in the space. However, the syntax t use the limits in such cases is different. Instead of xlim and ylim, we need to use the set_axes functions.
Example (6)
# Import all the required libraries and modules in the code
import matplotlib.pyplot as plt
import numpy as np
# Creating a user-defined function named lim_change
def lim_change(x, y):
    # Creating the figure object
    fig = plt.figure(figsize=(9, 9))
    ax=plt.axes()
    # Plotting the figure
    ax.plot(x,y, color='purple')
    # Putting a limit on the x-axis
    ax.set_xlim(left =-20,right=20)
    # Defining the title for the plot
    ax.set_title("Demonstrating the change of x and y axis limits ")
    # Displaying the plot
    plt.show()
# Creating the main() function
def main():
    # Creating the x coordinates of the data points
    x = np.arange(0, 10, 0.1)
    # Creating the y coordinates of the data points
    y = np.power(x,3)+np.power(x,2)+np.power(x,1)+np.power(x,0)
    # Calling the lim_change function
    lim_change(x, y)
# calling the main function
if __name__ == '__main__':
    main()
Output:
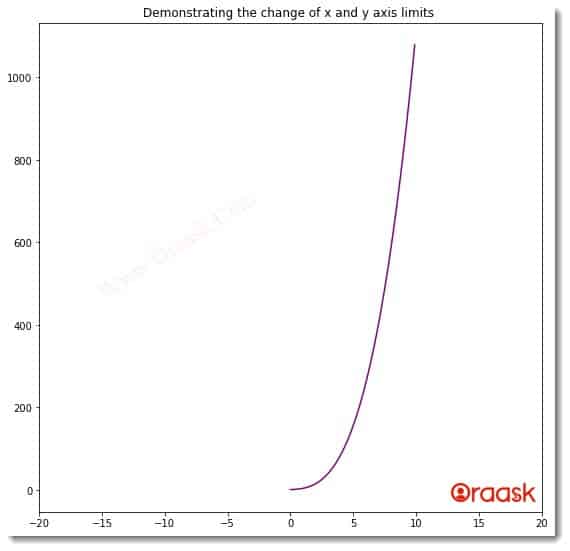
Explanation:
- In the code, firstly, we imported the libraries and packages in our code. We used the aliasing technique to rename the libraries in our code for convenience in writing our code.
- Next, we created a user-defined function named lim_change. This is a void function, and it takes two arguments, namely x and y. Under this function, we first created the fig object using the figure() function and set the size of the figure. Next, we created the axes object using the axes function. We used the plot function of the axes objects to plot the figure. We also used the color attribute to change the color of the plot.
- Next, we set the limits along the x-axis only with the help of the set_xlim function of the axes object.
We set the title of the plot using the set_title function.
- After the lim_change function, we created the main function. Under this function, we created the coordinates for the data points. We called the lim_change function, and finally, we called the main function using the following lines of codes:
if __name__ == ‘__main__’:
main()
Conclusion:
This article talked about setting limits to the matplotlib axes using the xlim and ylim functions. We also talked about the set_xlabel and the set_ylabel functions. Programmers mainly use this feature when they need to view only a tiny part of the total graph.
We strongly recommend the readers look up the python matplotlib documentation to understand the associated functions and attributes more.


