How Can We Help?
Matplotlib allows us to customize a vast number of aspects. We can change the line color depending on the values of y with the help of the existing functions of python matplotlib and our logic in the code. Sometimes programmers need this technique to visualize better the change in the values of y throughout the graph.
In this article, we will understand how to change the line color based on the values of y.
[adinserter block=”1″]
Changing The Color Through cmap
The cmap is a popular method used by programmers to assign the color in the graph dynamically. We can apply this method to different types of plots like line charts, scatter plots, etc.
We first need to make the colormap using the cm.jet function of the matplotlib library. Next, we need to define specific rules by which we want to define the color.
Example (1)
# import all the necessary libraries and packages in our code
import matplotlib.pyplot as plt
import numpy as np
# Creating a user-defined function change_color
def change_color(x, y):
    # Creating the figure object
    plt.figure(figsize=(9, 9))
    # Creating the axes object
    ax = plt.axes()
    # Creating the color map
    colors = plt.cm.jet(np.linspace(0,1,30))
    # Plotting the figure
    for i in range(30):
        ax.plot(x, i+y, c=colors[i])
    # Setting title of the plot
    ax.set_title('Demonstrating changing line color based on the y value')
    # Defining the x label
    ax.set_xlabel('x coordinates')
    # Defining the y label
    ax.set_ylabel('y coordinates')
    # Displaying the plot
    plt.show()
# Defining the main function
def main():
    # Creating the x coordinates for the data points
    x = np.linspace(-15, 15, 100)
    # Defining the y coordinates for the data points
    y = np.ones(100)
    # Calling the change_color function
    change_color(x, np.array(y))
# Calling the main function
if __name__ == "__main__":
    main()
Output:
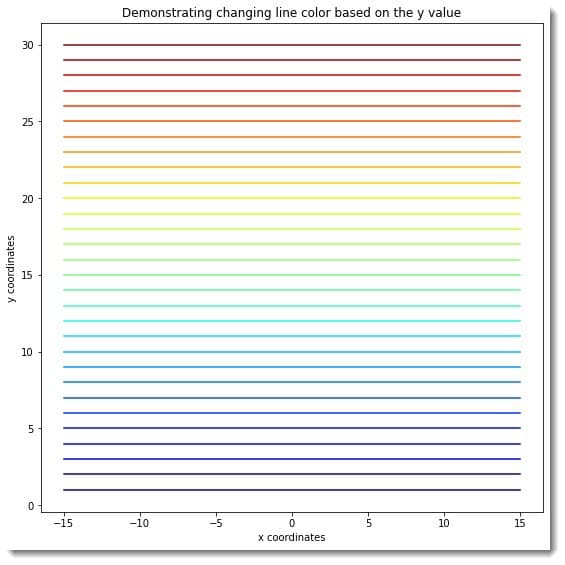
Explanation:
[adinserter block=”2″]
- First, we imported all the necessary libraries and packages in the code using the import statement of python. We have used the technique of aliasing here for convenience in writing the code.
- Next, we have defined a user-defined function named change_color. The function is a void function and takes two arguments called x and y. Under this function, we first created the figure object using the figure function of python matplotlib. Next, we created the colormap using the cm.jet function of python matplotlib. We have created thirty data points for the color map.
- Now we have iterated thirty times, and under each iteration, we have plotted a line and passed a c argument to this to define its color. This process gives a unique color to the plots.
- Next, we set the title to the plot using the title function of matplotlib. We also used the set_xlabel and the set_ylabel functions to define the labels along the x and the y axis, respectively. We used the show function to display the plot. Note that this is, however, optional to use in Jupyter Notebook.
- After the change_color function, we created the main function, which is the driving code of the program. Under this function, we defined all the data points required for the graph. We used the linspace function of the numpy library to create the data points for the x-axis. The linspace function takes three arguments, called to start, stop, and several elements. The start defines the number we need to start the iteration, and the stop defines the number to which we need to perform the iteration. Finally, the last parameter is the number of elements we need to have in the array.
- We used the one’s function to get an array that only consists of 1 as the elements. This function takes only one argument: the number of 1 that should reside in the array. We called the change_color function to plot the graph.
- Finally, we called the main function with the help of the following lines of codes: if __name__ == “main“: main()
Changing The Color Based On The Values Of Y Through Queries
We sometimes also need to change the color of the plot as per some queries. Python also allows us to change the color of the plot using different sets of conditions too. Matplotlib does not have any direct function to change the color of the plot based on the conditions. We need to use a few functions, like masked_where, etc., as an indirect method to achieve the same.
We need to take care of the following points before we proceed with this code:
- First, we need to create the array for the data points.
- Next, we need to use the masked_where function. This function will mask specific values based on the specified conditions.
- Now we need to plot the array.
[adinserter block=”3″]
Example (2)
# import all the necessary libraries and packages in our code
import matplotlib.pyplot as plt
import numpy as np
# Creating a user-defined function change_color


def change_color(t, upper, lower, middle):
    # Ceating the figure and the ax object
    plt.figure(figsize=(9, 9))
    # Creating the axes object
    ax = plt.axes()
    # Plotting the figure
    ax.plot(t, middle, t, lower, t, upper)
    # Setting title of the plot
    ax.set_title('Demonstrating changing line color as per the value of y')
    # Defining the x label
    ax.set_xlabel('x axis')
    # Defining the y label
    ax.set_ylabel('y axis')
    # Displaying the plot
    plt.show()
# Defining the main function


def main():
    # Creating the x coordinates for the data points
    x = np.linspace(1, 10, 100)
    # Defining the y coordinates for the data points
    y = np.cos(x)
    y_max = 0.5
    y_min = -0.5
    # Defining our queries
    supper = np.ma.masked_where(y < y_max, y)
    print(f"The supper array is:{supper}")
    slower = np.ma.masked_where(y > y_min, y)
    print(f"The slower array is:{slower}")
    smiddle = np.ma.masked_where((y < y_min) & (y > y_max), y)
    print(f"The smiddle array is:{smiddle}")
    # Calling the change_color function
    change_color(x, supper, slower, smiddle)


# Calling the main function
if __name__ == "__main__":
    main()
Output:
[adinserter block=”4″]
The supper array is:[0.5403023058681398 — — — — — — — — — — — — — — — — — —
— — — — — — — — — — — — — — — — — — — — — — — —
— — — — 0.5314727874367585 0.6061789562513957 0.6758788309121303
0.7399967760039677 0.7980032559988883 0.8494192085693526
0.8938200010551268 0.9308389374078612 0.960170286650366
0.9815718078392295 0.9948667506776827 0.9999453152561079
0.9967655588645231 0.9853537423878862 0.9658041134234179
0.9382781279111281 0.9030031167059227 0.8602704081037683
0.810432921827544 0.7539022543433046 0.6911452795786652
0.6226802931172001 0.5490727317130796 — — — — — — — — — — — —
— — — — — — — — — — — — — — — — — –]
The slower array is:[– — — — — — — — — — — — — -0.5737047223085319
-0.6456933542311115 -0.7123493515724922 -0.7731222176082798
-0.8275100430577031 -0.8750636512382283 -0.9153903077136359
-0.9481569637984231 -0.9730930071311598 -0.9899924966004454
-0.9987158631657161 -0.9991910625262126 -0.9914141701184772
-0.9754494135284317 -0.9514286420503495 -0.9195502377735175
-0.8800774771896732 -0.8333363568523281 -0.7797129010453654
-0.7196499736962603 -0.6536436208636119 -0.582238974005546
-0.5060257478629665 — — — — — — — — — — — — — — — — — —
— — — — — — — — — — — — — — — — — — — — — — — —
— — — — -0.5651077248199002 -0.6376724684471946 -0.7049708201650193
-0.7664469781902593 -0.8215932249135326 -0.8699541200234691
-0.9111302618846769 -0.9447815861050272 -0.9706301740501315
-0.9884625481101503 -0.9981314347628233 -0.999556980872002
-0.9927274131765413 -0.9776991355229866 -0.9545962630390319
-0.923609597094902 -0.884995049518227 -0.8390715290764524]
The smiddle array is:[ 0.54030231 0.46167915 0.37924309 0.29367495 0.20568142 0.11598921
0.02533907 -0.06552034 -0.15583863 -0.24486989 -0.33187882 -0.41614684
-0.49697799 -0.57370472 -0.64569335 -0.71234935 -0.77312222 -0.82751004
-0.87506365 -0.91539031 -0.94815696 -0.97309301 -0.9899925 -0.99871586
-0.99919106 -0.99141417 -0.97544941 -0.95142864 -0.91955024 -0.88007748
-0.83333636 -0.7797129 -0.71964997 -0.65364362 -0.58223897 -0.50602575
-0.42563337 -0.34172578 -0.25499596 -0.16616018 -0.07595213 0.0148832
0.10559561 0.19543593 0.28366219 0.36954574 0.45237731 0.53147279
0.60617896 0.67587883 0.73999678 0.79800326 0.84941921 0.89382
0.93083894 0.96017029 0.98157181 0.99486675 0.99994532 0.99676556
0.98535374 0.96580411 0.93827813 0.90300312 0.86027041 0.81043292
0.75390225 0.69114528 0.62268029 0.54907273 0.4709305 0.38889897
0.3036556 0.21590442 0.12637012 0.03579217 -0.05508138 -0.14550003
-0.23471703 -0.32199555 -0.40661479 -0.48787588 -0.56510772 -0.63767247
-0.70497082 -0.76644698 -0.82159322 -0.86995412 -0.91113026 -0.94478159
-0.97063017 -0.98846255 -0.99813143 -0.99955698 -0.99272741 -0.97769914
-0.95459626 -0.9236096 -0.88499505 -0.83907153]
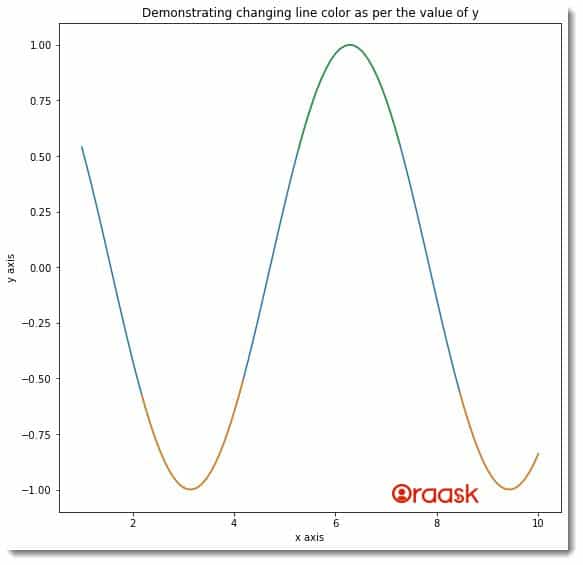
Explanation:
- First, we imported the libraries in the code using the import statement of python. Note that we can import the libraries and packages anywhere in the code.
- Next, we created a user-defined function named change_color. This is a void function, and it takes four parameters. Under this function, we first used the figure function to define the size of the plot using the figsize attribute. We used the axes function to create the axes object.
- Next, we plotted the graph using the plot function. We have passed six parameters to the function-3 pairs. Each pair is x, and the y value pairs for the three portions of the plot. Next, we used the set_title function to define the plot’s title. We also used the set_xlabel and the set_ylabel functions to define the labels along the x and the y axis.
- After the change_color function, we defined the main function. This is the driving code of the program. Under this function, we defined all the data points for the graph. We defined the minimum and the maximum value of y for the queries we need to perform later. You can choose any such value depending on the requirement.
- The statement supper = np.ma.masked_where(y \< y_max, y) defines that we need to mask all the elements whose value is less than the y_max, which is 0.5 here.
- Next, we used the masked_where function to mask the passed queries. We called the change_color function to plot the graph. Finally, we called the main function using the following lines of codes: if __name__ == “main“: main()
[adinserter block=”5″]
Check This: There is a full guide on Matplotlib Colors if you want to know more about colors in matplotlib.
Matplotlib Change Line Color Opacity as per values of y
We can also change the line color opacity as per the values of y. In matplotlib, this facility is available through the alpha attribute of the plot function. The alpha attribute takes float values between 0 and 1 (inclusive). Zero defines no opacity, and 1 defines the maximum intensity of the color.
Example (3)
# import all the necessary libraries and packages in our code
import matplotlib.pyplot as plt
import numpy as np
# Creating a user-defined function change_color


def change_color(x, y):
    # Creating the figure object
    fig = plt.figure(figsize=(9, 9))
    # Creating the axes object
    ax = plt.axes()
    # Plotting the figure
    for i in range(30):
        ax.plot(x, i+y, color="green", alpha=i*0.03)
    # Setting title of the plot
    ax.set_title(
        'Demonstrating changing line color as per changing values of y')
    # Defining the x label
    ax.set_xlabel('x axis')
    # Defining the y label
    ax.set_ylabel('y axis')
    # Displaying the plot
    plt.show()
# Defining the main function


def main():
    # Creating the x coordinates for the data points
    x = np.linspace(-15, 15, 100)
    # Defining the y coordinates for the data points
    y = np.cos(x)
    # Calling the change_color function
    change_color(x, np.array(y))


# Calling the main function
if __name__ == "__main__":
    main()
[adinserter block=”6″]
Output:
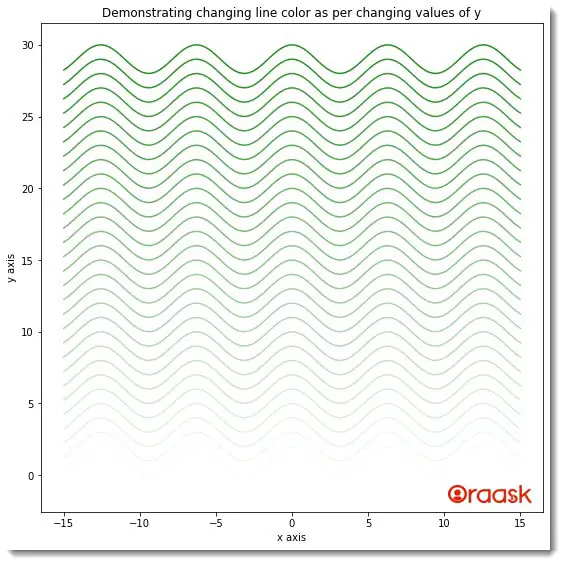
Explanation:
The above code is similar to the example code 1 discussed in this article. We only used the attribute alpha in the iteration instead of the colormap to define the opacity of the line. We set the values of alpha dynamically such that we get larger alpha values for a more significant value of y.
Changing The Line Color In a Three-dimensional Plot
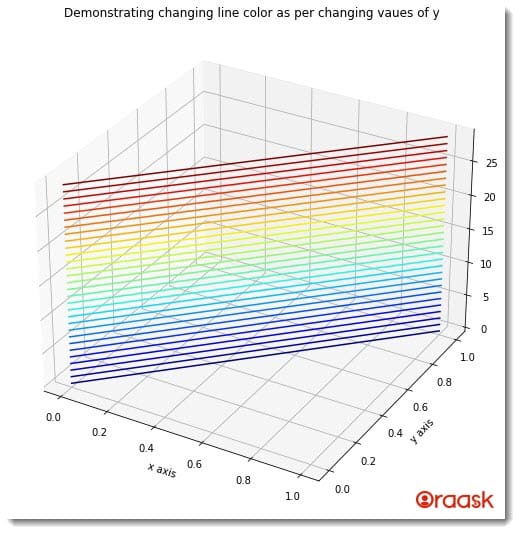
Matplotlib also allows us to change the color of the line plot as per the values of y, z coordinates, etc. Below are a few example codes which illustrate the same without explanation.
Example (4)
[adinserter block=”7″]
# import all the necessary libraries and packages in our code
import matplotlib.pyplot as plt
import numpy as np
# Creating a user-defined function change_color


def change_color(z,x, y):
    # Creating the figure object
    fig = plt.figure(figsize=(9, 9))
    # Creating the color map
    colors = plt.cm.jet(np.linspace(0,1,30))
    # Creating the axes object
    ax = plt.axes(projection ='3d')
    # Plotting the figure
    for i in range(30):
        ax.plot3D(x,y, i,c=colors[i])
        # ax.plot(x, i+y, color="green", alpha=i*0.03)
    # Setting title of the plot
    ax.set_title(
        'Demonstrating changing line color as per changing values of y')
    # Defining the x label
    ax.set_xlabel('x axis')
    # Defining the y label
    ax.set_ylabel('y axis')
    # Displaying the plot
    plt.show()
# Defining the main function


def main():
    z = np.linspace(0, 1, 100)
    x = np.linspace(0, 1, 100)
    y = np.linspace(0, 1, 100)
    # Calling the change_color function
    change_color(z,x,y)


# Calling the main function
if __name__ == "__main__":
    main()
Output:
[adinserter block=”8″]
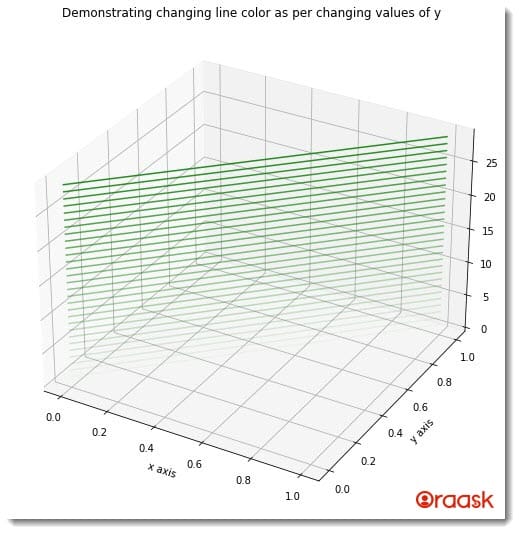
Example (5)
# import all the necessary libraries and packages in our code
import matplotlib.pyplot as plt
import numpy as np
# Creating a user-defined function change_color


def change_color(z,x, y):
    # Creating the figure object
    fig = plt.figure(figsize=(9, 9))
    # Creating the axes object
    ax = plt.axes(projection ='3d')
    # Plotting the figure
    for i in range(30):
        ax.plot3D(x,y, i, 'green',alpha=i*0.03)
        # ax.plot(x, i+y, color="green", alpha=i*0.03)
    # Setting title of the plot
    ax.set_title(
        'Demonstrating changing line color as per changing values of y')
    # Defining the x label
    ax.set_xlabel('x axis')
    # Defining the y label
    ax.set_ylabel('y axis')
    # Displaying the plot
    plt.show()
# Defining the main function


def main():
    z = np.linspace(0, 1, 100)
    x = np.linspace(0, 1, 100)
    y = np.linspace(0, 1, 100)
    # Calling the change_color function
    change_color(z,x,y)


# Calling the main function
if __name__ == "__main__":
    main()
Output:
[adinserter block=”9″]
Conclusion
In this article, we learned how to change the line color as per the values of the coordinates. We used the color function and camp methods, as well as many other functions, to achieve the same. We learned how to change the line’s color in two and three dimensions.
We strongly recommend that the readers go through the python matplotlib documentation to understand the topic more. We also encourage the readers to post their queries in the Oraask Q&A section.
[adinserter block=”10″]


