How Can We Help?
Constructing a square in matplotlib is a slightly tricky task. However, several methods in python and matplotlib allow users to make multiple squares. This article will explain how to construct multiple squares in matplotlib.
Using The vlines and the hlines Functions
We can use Matlab’s vlines and hlines functions to make squares manually in matplotlib. Although this is not standard practice to make squares in matplotlib, this is still worth understanding and serves the purpose we will discuss next.
[adinserter block=”1″]
- The hlines function takes three basic parameters. First, it takes the y coordinates with which we need the horizontal line(along the x-axis). The second parameter defines the lower limit of the x-axis, and the third parameter defines the maximum limit along the x-axis up to which the line should run.
- The vlines function takes three basic parameters. First, it takes the x coordinates with which we need the vertical line(along the y-axis). The second parameter defines the lower limit of the y-axis, and the third parameter defines the maximum limit along the y-axis up to which the line should run.
Example (1)
# Importing the python libraries and packages
import matplotlib.pyplot as plt
# Defining the main function
def main():
    # Adding the figure object
    plt.figure(figsize=(9,9))
    plt.vlines(1,1,5)
    plt.vlines(5,1,5)
    plt.hlines(1,1,5)
    plt.hlines(5,1,5)
    plt.vlines(1,1,7)
    plt.vlines(7,1,7)
    plt.hlines(1,1,7)
    plt.hlines(7,1,7)
    # Adding the title to the plot
    plt.title("Plotting multiple squares in the plot")
    # Adding label along the x-axis
    plt.xlabel("X coordinates")
    # Adding label along the y axis
    plt.ylabel("Y coordinates")
    plt.show()
# Calling the main function
if __name__ == "__main__":
    main()
Output:
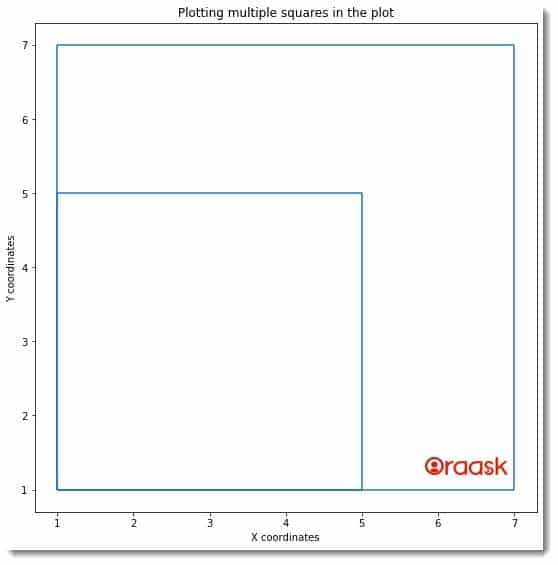
Explanation:
[adinserter block=”2″]
- We made the main function which is the driving code of the program. Under this function, we defined the size of the figure using the figure attribute of the function.
- We used the vlines and the hlines to define the dimensions of the squares. We, as Ursul, set the title of the plot using the title function and the labels along the axes using the xlabel and the ylabel functions. For example, vlines with (1,1,5) as the parameters define that the line should be vertical and start from the x coordinate 1. It should run from the y coordinate 1 to 5.
- We finally called the main function using the following lines of codes: if __name__ == “main“: main()
Using The Patches Module
One of the most popular techniques the programmers often use to construct the square is the patches module of the matplotlib library. The square is nothing but a rectangle whose all sides are equal. Hence we can use this property to construct squares out of functions which helps to make the rectangle. One such function available in python Matploltlib is the patches. Rectangle function of matplotlib. This function takes three significant parameters.
- The first parameter is in the form of a tuple. This tuple should contain two elements. The first element is the x-coordinates of the square’s mount point, and the second one is the y-coordinate of the mount point of the square.
- The second parameter is the width of the rectangle/square.
- The third parameter is height.
[adinserter block=”3″]
Example (2)
# Importing all the necessary libraries and packages in the code
import matplotlib
import matplotlib.pyplot as plt
# Defining a user-defined function named Square


def square(x1, y1, x2, y2, side1, side2):
    # Defining the size of the figure
    fig = plt.figure(figsize=(9, 9))
    # Creating the subplot object
    ax = fig.add_subplot(111)
    # Defining the Square through the Rectangle class
    rect1 = matplotlib.patches.Rectangle(
        (x1, y1), side1, side1, color='yellow')
    # Defining the Square through the Rectangle class
    rect2 = matplotlib.patches.Rectangle((x2, y2), side2, side2, color='pink')
    # Adding to the plot
    ax.add_patch(rect1)
    ax.add_patch(rect2)
    # Adding limit along the x-axis
    plt.xlim([0, 10])
    # Adding limit along the y axis
    plt.ylim([0, 10])
    # Adding the title to the plot
    plt.title("Plotting multiple squares in the plot")
    # Adding label along the x-axis
    plt.xlabel("X coordinates")
    # Adding label along the y axis
    plt.ylabel("Y coordinates")
    plt.show()
# Defining the driving code of the program


def main():
    # Defining the mount x-coordinate of the first Square
    x1 = 2
    # Defining the mount y-coordinate of the first Square
    y1 = 3
    # Defining the mount x-coordinate of the second square
    x2 = 7
    # Defining the mount y-coordinate of the second square
    y2 = 7
    # Defining the side of the first Square
    side1 = 2
    # Defining the side of the second square
    side2 = 2
    # Calling the square function
    square(x1, y1, x2, y2, side1, side2)


# Callin the main function
if __name__ == "__main__":
    main()
Output:
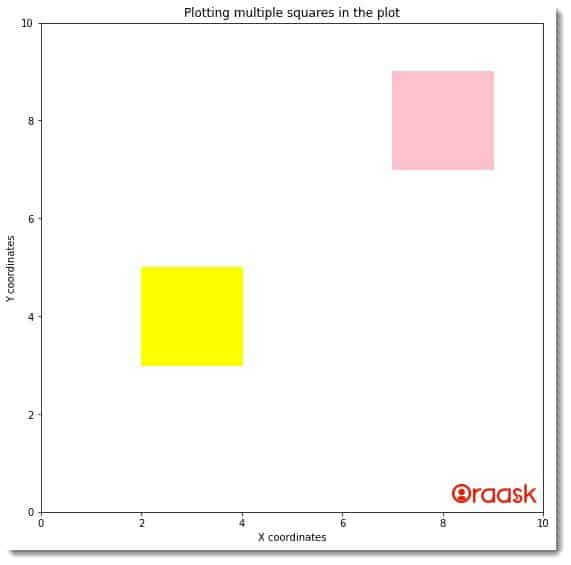
Explanation:
- First, we imported all the necessary libraries and packages in our code using the import statement of python. We have used the aliasing names for better convenience in writing the codes in our program.
- Next, we have created a user-defined function named square. This void function takes six arguments, namely x1, y1, x2, y2, side1, and side2. Under this function, we first defined the plot’s size using the function’s figsize attribute. Next, we defined the axes object using the add_subplot function. Next, we defined the first rectangle’s dimension and created the object for plotting the two rectangles. We passed the appropriate parameters and color parameters to the function.
- Next, we used the add_patch function to make the rectangles visible in the plot.
- We used the xlim and ylim functions to set the limits along the plots’ x and y axis of the plots. Next, we also set the title of the function using the title function of matplotlib. We used the xlabel and the ylabel functions to define the labels along the x and y-axis.
- After the square function, we defined the main function. The main function is the driving code of the program. Under this function, we have defined all the data points for the two squares we have defined. We called the square function with appropriate parameters to plot the squares. Next, we called the main function with the help of the following lines of codes: if __name__ == “main“: main()
Matplotlib also allows us to change the angle or the inclination of the squares concerning the x-axis.
[adinserter block=”4″]
To do so, we must pass another parameter to the rectangle, namely the angle parameter. This function will take float as an argument. Also, the angle should be in degrees.
Example (3)
# Importing all the necessary libraries and packages in the code
import matplotlib
import matplotlib.pyplot as plt
# Defining a user-defined function named Square


def square(x1, y1, x2, y2, side1, side2):
    # Defining the size of the figure
    fig = plt.figure(figsize=(9, 9))
    # Creating the subplot object
    ax = fig.add_subplot(111)
    # Defining the Square through the Rectangle class
    rect1 = matplotlib.patches.Rectangle(
        (x1, y1), side1, side1,angle=30, color='blue')
    # Defining the Square through the Rectangle class
    rect2 = matplotlib.patches.Rectangle((x2, y2), side2, side2,angle=45, color='green')
    # Adding to the plot
    ax.add_patch(rect1)
    ax.add_patch(rect2)
    # Adding limit along the x-axis
    plt.xlim([0, 10])
    # Adding limit along the y axis
    plt.ylim([0, 10])
    # Adding the title to the plot
    plt.title("Plotting multiple squares in the plot")
    # Adding label along the x-axis
    plt.xlabel("X coordinates")
    # Adding label along the y axis
    plt.ylabel("Y coordinates")
    plt.show()
# Defining the driving code of the program


def main():
    # Defining the mount x-coordinate of the first Square
    x1 = 2
    # Defining the mount y-coordinate of the first Square
    y1 = 1
    # Defining the mount x-coordinate of the second square
    x2 = 5
    # Defining the mount y-coordinate of the second square
    y2 = 5
    # Defining the side of the first Square
    side1 = 3
    # Defining the side of the second square
    side2 = 2
    # Calling the square function
    square(x1, y1, x2, y2, side1, side2)


# Callin the main function
if __name__ == "__main__":
    main()
Output:
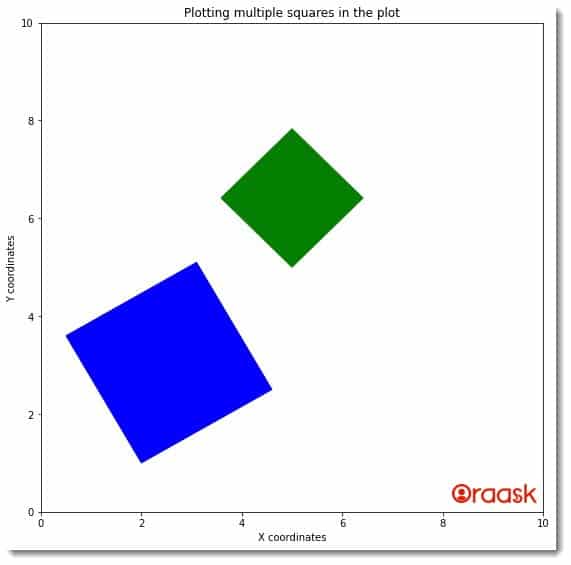
In the above code, we have used the angle parameter to define the angle of the squares concerning the x-axis. We have defined the blue square to be at an angle of 30 degrees and the green square at 45 degrees with the x-axis.
[adinserter block=”5″]
Creating squares Without Filling
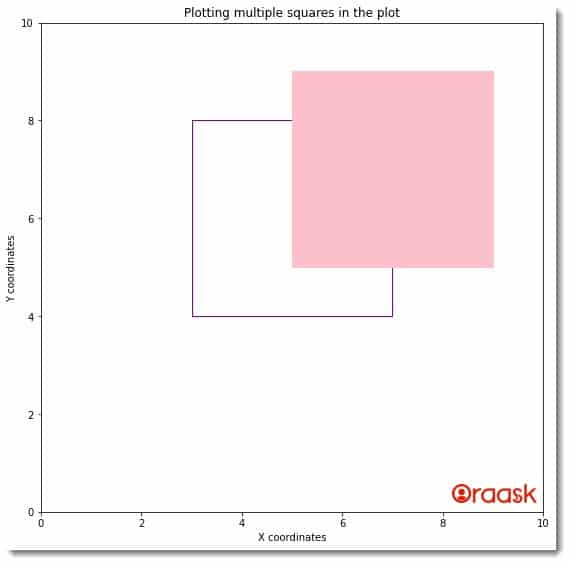
Sometimes we may need to create the square without filling the area. We need to use the attribute “fill” in such a case. The fill attribute takes two arguments which are boolean False and boolean True. If we set the value of this attribute to False, then there will be no fillings of the area of the square.
Example (4)
# Importing all the necessary libraries and packages in the code
import matplotlib
import matplotlib.pyplot as plt
# Defining a user-defined function named Square


def square(x1, y1, x2, y2, side1, side2):
    # Defining the size of the figure
    fig = plt.figure(figsize=(9, 9))
    # Creating the subplot object
    ax = fig.add_subplot(111)
    # Defining the Square through the Rectangle class
    rect1 = matplotlib.patches.Rectangle(
        (x1, y1), side1, side1, color='purple',fill=False)
    # Defining the Square through the Rectangle class
    rect2 = matplotlib.patches.Rectangle((x2, y2), side2, side2, color='pink')
    # Adding to the plot
    ax.add_patch(rect1)
    ax.add_patch(rect2)
    # Adding limit along the x-axis
    plt.xlim([0, 10])
    # Adding limit along the y axis
    plt.ylim([0, 10])
    # Adding the title to the plot
    plt.title("Plotting multiple squares in the plot")
    # Adding label along the x-axis
    plt.xlabel("X coordinates")
    # Adding label along the y axis
    plt.ylabel("Y coordinates")
    plt.show()
# Defining the driving code of the program


def main():
    # Defining the mount x-coordinate of the first Square
    x1 = 3
    # Defining the mount y-coordinate of the first Square
    y1 = 4
    # Defining the mount x-coordinate of the second square
    x2 = 5
    # Defining the mount y-coordinate of the second square
    y2 = 5
    # Defining the side of the first Square
    side1 = 4
    # Defining the side of the second square
    side2 = 4
    # Calling the square function
    square(x1, y1, x2, y2, side1, side2)


# Callin the main function
if __name__ == "__main__":
    main()
Output:
[adinserter block=”6″]
Making Square Inside An image
We can also make the square inside any image imported using any library in python. This technique is handy for marking different locations in the image with the help of a rectangle.
Example (5)
# Import the libraries
import matplotlib.pyplot as plt
from matplotlib.patches import Rectangle
from PIL import Image
def main():
    # Adding the figure object
    plt.figure(figsize=(9,9))
    #d Reading the image
    plt.imshow(Image.open('mac.jpg'))
    # Adding a rectangle to the image
    plt.gca().add_patch(Rectangle((500,100),600,600,edgecolor='green',facecolor='none',lw=4))
    # Adding the title to the plot
    plt.title("Plotting multiple squares in the plot")
    # Adding label along the x-axis
    plt.xlabel("X coordinates")
    # Adding label along the y axis
    plt.ylabel("Y coordinates")
    plt.show()
# Defining the main function
if __name__ == "__main__":
    main()
Output:
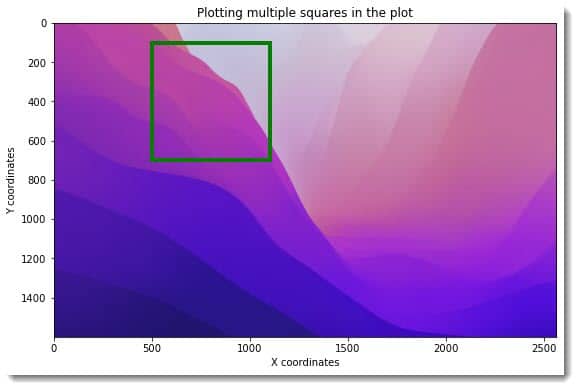
Explanation:
[adinserter block=”7″]
- First, we have imported the required functions in our code using the import statement of python.
- Next, we have created the main function. Under the function first, we have defined the size of the plot using the figure function of matplotlib. Next, we used the show function to read the image. Make sure you try to read a valid image located at the location you passed to the function.
- We have now used the gca function and the rectangle function to plot the rectangle in the plot. We have set the color of the square to green.
- Next, we have defined the title for the plot using the title
- .We also defined labels along the axes using the xlabel and the ylabel functions. Finally, we called the main function using the following lines of codes: if __name__ == “main“: main()
[adinserter block=”8″]
Conclusion
In this article, we have learned how to add multiple squares in the plot using the matplotlib library of python. We have used the patches library of the matplotlib for the same. We also learned about many associated attributes and functions.
We strongly recommend that the readers go through the python matplotlib documentation to understand the topic more.


