How Can We Help?
The contour plot is a special graph where we plot constant z slices called contours. We use this graph to represent the three-dimensional surface. The main objective of using this plot is to represent any three-dimensional surface in a two-dimensional plot. This article will teach us how to create a legend in the contour plot in matplotlib.
Prerequisite
Before we proceed with the codes, we presume that the reader has sound knowledge of contour plots. We also need some libraries and packages to code. They are namely matplotlib and NumPy. In case you haven’t installed them, then perform the following:
If you are a windows user, then open the PowerShell and run the following commands:
pip install matplotlib numpy
If you are a Linux or a macOS user, then open the bash terminal and run the following commands:
pip install matplotlib numpy
[adinserter block=”1″]
Legend Makes no Sense in the Contour Plot
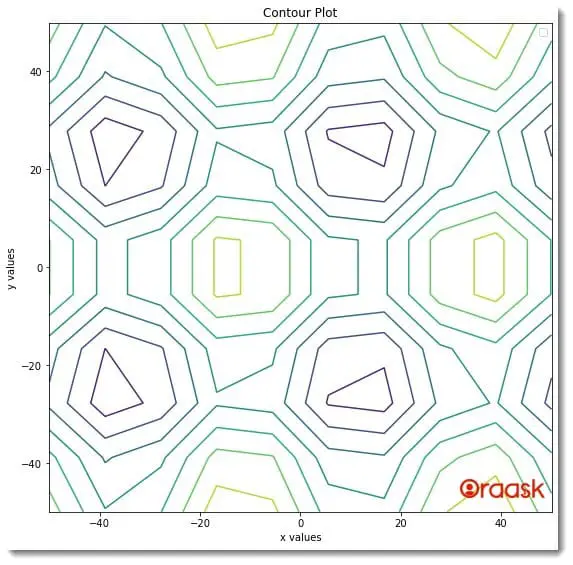
The contour plot represents the three-dimensional plot in the three-dimensional format. Practically it does not make sense to use the legend with the contour plot. If you try to make a legend on the contour plot with conventional techniques, you will see no changes in the plot.
Example (1)
# Import all the necessary libraries and modules in our code
import matplotlib.pyplot as plt
import numpy as np
def contour_plot(X, Y, Z):
    # Creating the figure object
    plt.figure(figsize=(9, 9))
    # Creating the axes object
    ax = plt.axes()
    # Plotting the contour plot
    ax.contour(X, Y, Z)
    # Defining the title of the plot
    ax.set_title('Contour Plot')
    # Defining the label along the x-axis
    ax.set_xlabel('x values')
    # Defining the label along the y axis
    ax.set_ylabel('y values')
    ax.legend(["Legend on the contour plot"])
    # Displaying the contour plot
    plt.show()
# Creating the main() function
def main():
    # Creating the x-axis value of the data points
    x = np.linspace(-50, 50, 10)
    # Creating the y-axis value of the data points
    y = np.linspace(-50, 50, 10)
    # Creating a 2-D grid of features
    X, Y = np.meshgrid(x, y)
    # Defining the custom function to get the z values
    z = np.sin(X)+np.cos(Y)
    # Calling the contour() function
    contour_plot(X, Y, z)


# Calling the main() function
if __name__ == "__main__":
    main()
[adinserter block=”2″]
Output:

Although we have tried to use the legend function with the code, we haven’t got any legend.
Using the legend_elements Method
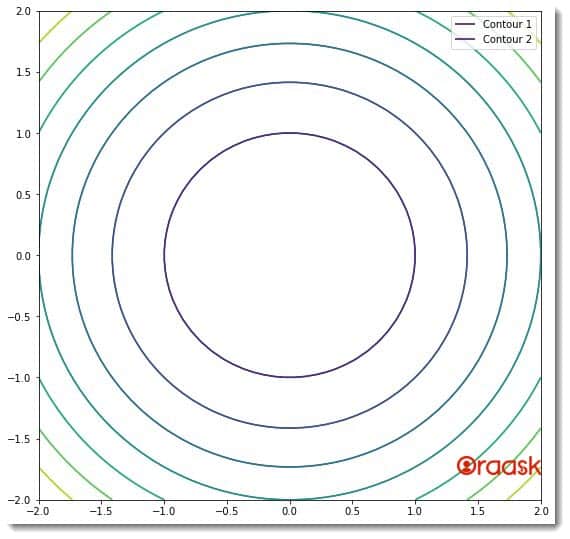
We can create a legend for the contour plot using the legend_element method. We need to follow the following method for the same:
First, we need to grapes the legend element using the legend_elements function. Next, we need to use the legend function and define the texts that we need to display in the legend
Example (2)
[adinserter block=”3″]
# Import all the necessary libraries and modules in our code
import matplotlib.pyplot as plt
import numpy as np
# Create a user-defined function named contour plot


def contour_plot(X1, Y1, Z1, X2, Y2, Z2):
    # Creating a figure object
    plt.figure(figsize=(9, 9))
    # Plotting the first contour plot
    c1 = plt.contour(X1, Y1, Z1)
    # Plotting the second contour plot
    c2 = plt.contour(X2, Y2, Z2)
    # Creaing the legend element objects
    h1, l1 = c1.legend_elements()
    h2, l1 = c2.legend_elements()
    # Creating the legend for the plot
    plt.legend([h1[0], h2[1]], ['Contour 1', 'Contour 2'])
    # Displaying the plot
    plt.show()
# Creating the main() function


def main():
    # Creating data points for the contour plot
    x1 = np.linspace(-2, 2)
    y1 = np.linspace(-2, 2)
    X1, Y1 = np.meshgrid(x1, y1)
    z1 = X1**2+Y1**2
    x2 = np.linspace(-2, 2)
    y2 = np.linspace(-2, 2)
    X2, Y2 = np.meshgrid(x2, y2)
    z2 = X2**2+Y2**2
    # Calling the contour_plot to plot the graph
    contour_plot(x1, y1, z1, x2, y2, z2)


# Calling the main() function
if __name__ == "__main__":
    main()
Output:

Explanation:
- First, we have imported the pyplot module and the numpy library in the code using the import statement of python.
- Next, we made a user-defined function named contour_plot function. The function takes six arguments, namely X1, Y1, Z1, X2, Y2, and Z2. Under this function, we first defined the size of the figure using the figsize attribute of the figure function. We used the contour function to plot the graph.
- Next, we grabbed the legend element using the legend_elements function. We used the legend function to define the legend in the plot. Note that the first list of the values passed to this function is the index of the legend, and the second argument is the legend’s text.
- Now, we use the show function to display the plot. Note that using the show function with the Jupyter Notebook is optional.
- Next, we have created the main function. This is the driving code of the program. Under this function, we have created the data points for the graph. We used the linspace function to create the data points. The linspace function takes three arguments, namely start, stop and step. The start is the number with which the iteration should start. The stop is the number up to which the iteration should run, and the step is the iterating step.
We created a mesh grid out of the values of x and y. We called the contour_plot function to plot the graph. - Next, we used the following lines of codes to plot the graph: if __name__ == “main“: main()
[adinserter block=”4″]
Using The Collection To Plot Legend
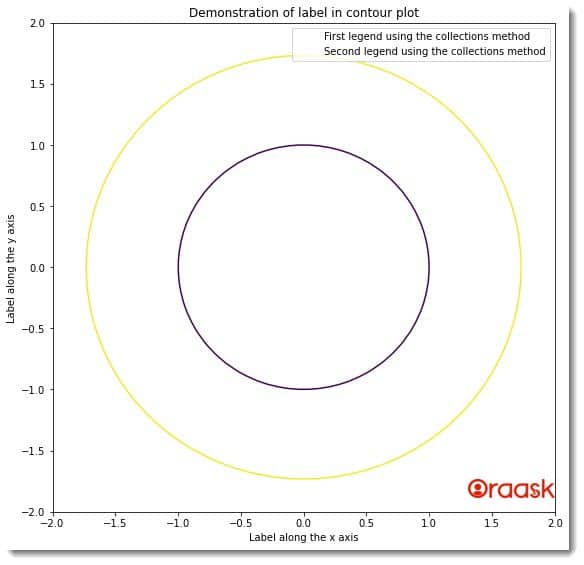
We can use the collections and the set_label function with it to define the legend of the contour plot. We need to adopt the following method for the same:
- First, we need to define the plot statement and create an object out of it.
- Next, we need to use the set_label function to define the plot legend.
Example (3)
# Import all the necessary libraries and modules in our code
import matplotlib.pyplot as plt
import numpy as np
# Creating a user-defined function named contour plot


def contour_plot(X1, Y1, Z1):
    # Creating a figure object
    plt.figure(figsize=(9, 9))
    # Plotting the first contour plot
    c = plt.contour(X1, Y1, Z1, levels=[1, 3])
    # Creating the legend for the plot
    c.collections[0].set_label('First legend using the collections method')
    c.collections[1].set_label('Second legend using the collections method')
    plt.legend()
    # Defining the title for the plot
    plt.title("Demonstration of label in contour plot")
    # Defining label along the x-axis
    plt.xlabel("Label along the x-axis")
    # Defining label along the y axis
    plt.ylabel("Label along the y axis")
    # Displaying the plot
    plt.show()
# Creating the main() function


def main():
    # Creating data points for the contour plot
    x1 = np.linspace(-2, 2)
    y1 = np.linspace(-2, 2)
    X1, Y1 = np.meshgrid(x1, y1)
    z1 = X1**2+Y1**2
    # Calling the contour_plot to plot the graph
    contour_plot(x1, y1, z1)


# Calling the main() function
if __name__ == "__main__":
    main()
[adinserter block=”5″]
Output:

Explanation:
- We imported the pyplot module and the numpy library in the code.
- Next, we created a user-defined function named contour_plot. This function takes three arguments, namely X1, Y1, and Z1. Under this function, we first created the figure object using the figure function.
- Now we plotted the figure using the contour function of the pyplot module. We created an object named c from the contour function.
- We used the collection method and the set_label function to define the legend of the function.
- Next, we defined the function’s title using the title function. We also defined the labels along the x and y axes using the xlabel and ylabel functions.
- Next, we created the main function. This is the driving code of the program. Under this function, we defined the data points of the plot using the linspace function.
- We called the contour_plot function with appropriate parameters to plot the graph.
- Finally, we called the main function.
Using proxy Artists
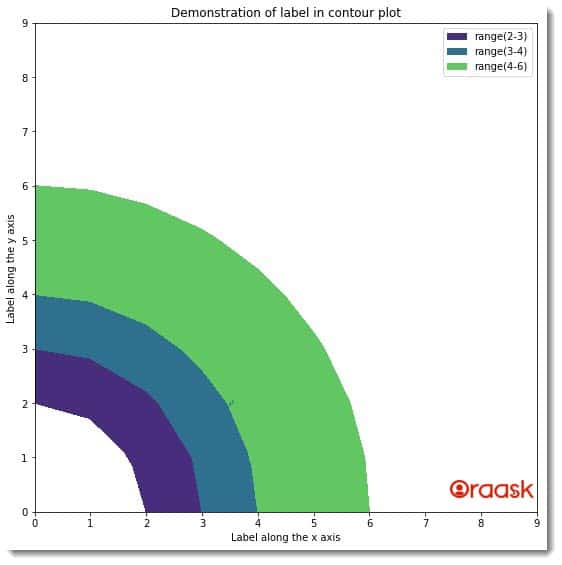
We can use proxy artists as an indirect method to create legends in the matplotlib. We can adopt the following methods for the same:
- First, we need to plot and define the graph using a variable.
- Next, we need to create a proxy by making a list and using the Rectangle function of the pyplot module.
- Finally, we need to use the legend function to create the legend and pass the value of the proxy to this function.
Example (4)
[adinserter block=”6″]
# Import all the necessary libraries and modules in our code
import matplotlib.pyplot as plt
import numpy as np
# Creating a user-defined function named contour plot


def contour_plot(X1, Y1, Z1):
    # Creating a figure object
    plt.figure(figsize=(9, 9))
    # Plotting the first contour plot
    c = plt.contourf(X1, Y1, Z1, levels=[2, 3, 4, 6])
    plt.clabel(c, inline=1, fontsize=10)
    # Creating the legend for the plot
    proxy = [plt.Rectangle((0, 0), 1, 1, fc=pc.get_facecolor()[0])
             for pc in c.collections]
    plt.legend(proxy, ["range(2-3)", "range(3-4)", "range(4-6)"])
    # Defining the title for the plot
    plt.title("Demonstration of label in contour plot")
    # Defining label along the x-axis
    plt.xlabel("Label along the x-axis")
    # Defining label along the y axis
    plt.ylabel("Label along the y axis")
    # Displaying the plot
    plt.show()
# Creating the main() function


def main():
    # Creating data points for the contour plot
    x1 = np.arange(10)
    y1 = np.arange(10)
    X1, Y1 = np.meshgrid(x1, y1)
    z1 = np.sqrt(X1**2+Y1**2)
    # Calling the contour_plot to plot the graph
    contour_plot(x1, y1, z1)


# Calling the main() function
if __name__ == "__main__":
    main()
Output:

[adinserter block=”7″]
Explanation:
- First, we need to import all the necessary libraries and packages in our code using the import statement of python. We imported the pyplot module and the numpy library for the same.
- Next, we created a user-defined function named contour_plot. This is a void function, and it takes three arguments, namely X1, Y1, and Z1.
- Under the contour_plot function, we first created a figure object using the figure function. We specified the plot’s size using the function’s figsize attribute.
- Next, we used the plot function to plot the graph. We stored this in a variable named c. We also defined levels for the plot using the levels attribute.
- Next, we used the list comprehension technique to make a legend figure from the collected data.
- We used the legend function to create the legend of the function. We also specified the title of the function using the title function of the pyplot. We used the xlabel and ylabel functions to define labels along the x and y axes.
- After the contour_plot function, we created the main function. This is the driving code of the program. Under this function, we have created all the data points we need to plot the graph.
- We called the contour_plot function to plot the graph.
- Finally, we called the main function using the following lines of code: if __name__ == “main“: main()
[adinserter block=”8″]
Conclusion:
This article taught us how to create a legend in the contour plot. We understood that we could not use the legend function directly to create legends in the contour plot. We must adopt several other techniques to create the legends, like using proxy artists, legends, etc.
We strongly recommend that readers look up the python matplotlib documentation to understand the topic more.


