How Can We Help?
Matplotlib is a popular data visualization library in Python that provides various tools and options to create high-quality graphs, charts, and plots. One such feature is the ability to adjust the size of figures in Matplotlib. Whether you want to increase or decrease the size of your figure, Matplotlib offers several methods to do so.
In this article, we will explore different ways to change the figure size in Matplotlib and create visually appealing plots that convey your data effectively.
Setting Matplotlib Figure Size with Figure() Function
The “Figure()” function in Matplotlib creates a new figure with a specified size. We can use the “figsize” parameter of the “Figure()” function to set the width and height of the figure in inches. Here’s an example code snippet that demonstrates how to set the figure size using the “Figure()” function:
Example (1)
import matplotlib.pyplot as plt

# create a new figure with size (6, 4)
fig = plt.figure(figsize=(6, 4))

# plot a simple line graph
x = [1, 2, 3, 4]
y = [2, 4, 6, 8]
plt.plot(x, y)

# set the title and axis labels
plt.title("Line Graph")
plt.xlabel("X-axis")
plt.ylabel("Y-axis")

# display the plot
plt.show()
Output:

Explanation:
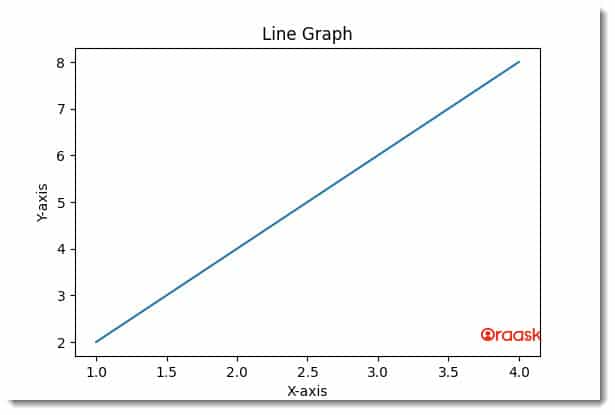
In this example, we created a new figure using the “Figure()” function and set the figure size to be 6 inches in width and 4 inches in height using the “figsize” parameter. We then plotted a simple line graph and added a title and axis labels to the plot. Finally, we displayed the plot using the “show()” function.
By adjusting the “figsize” parameter, we can create figures of different sizes that suit our visualization needs. It’s important to note that the “figsize” parameter takes a tuple of two values representing the width and height of the figure in inches.
The “Figure()” function is a convenient way to create a new figure and set its size simultaneously. However, if we want to create multiple subplots in a figure, we may prefer to use the “subplots()” function, which we’ll cover in the next section.
Setting Figure Size with subplots() function
The “subplots()” function in Matplotlib is used to create multiple plots in a single figure. We can also use this function to set the size of the figure. The “figsize” parameter of the “subplots()” function sets the width and height of the figure in inches. Here’s an example code snippet that demonstrates how to set the figure size using the “subplots()” function:
Example (2)
import matplotlib.pyplot as plt

# create a figure with 2 subplots and size (8, 4)
fig, (ax1, ax2) = plt.subplots(1, 2, figsize=(8, 4))

# plot a simple line graph on the first subplot
x = [1, 2, 3, 4]
y = [2, 4, 6, 8]
ax1.plot(x, y)
ax1.set_title("Line Graph")
ax1.set_xlabel("X-axis")
ax1.set_ylabel("Y-axis")

# plot a simple bar chart on the second subplot
labels = ['A', 'B', 'C', 'D']
values = [10, 20, 15, 5]
ax2.bar(labels, values)
ax2.set_title("Bar Chart")
ax2.set_xlabel("X-axis")
ax2.set_ylabel("Y-axis")

# adjust the layout and display the plot
plt.tight_layout()
plt.show()
Output:

Explanation:
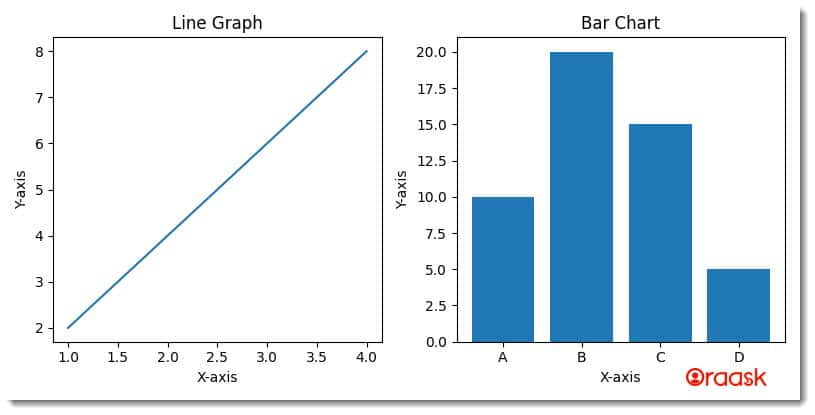
In this example, we created a figure with two subplots using the “subplots()” function and set the figure size to be 8 inches in width and 4 inches in height using the figsize parameter. We then plotted a simple line graph and a bar chart on the two subplots and added titles and axis labels to each plot. Finally, we used the “tight_layout()” function to adjust the layout and display the plot using the “show()” function.
By adjusting the “figsize” parameter, we can create figures of different sizes that suit our visualization needs, even when creating multiple subplots. It’s important to note that the “figsize” parameter takes a tuple of two values representing the width and height of the figure in inches.
The “subplots()” function is a powerful way to create multiple plots in a single figure and set their size simultaneously. However, if we want to create a single plot, we may prefer to use the “figure()” function instead, as demonstrated in the previous section.
Setting Figure Size with rcParams
Matplotlib provides a way to set default figure properties globally using “rcParams”. We can use the “rcParams” dictionary to set various properties, including the figure size. Here’s an example code snippet that demonstrates how to set the figure size using “rcParams“:
Example (3)
import matplotlib.pyplot as plt

# set the figure size globally
plt.rcParams['figure.figsize'] = (8, 4)

# plot a simple line graph
x = [1, 2, 3, 4]
y = [2, 4, 6, 8]
plt.plot(x, y)

# set the title and axis labels
plt.title("Line Graph")
plt.xlabel("X-axis")
plt.ylabel("Y-axis")

# display the plot
plt.show()
Output:

Explanation:
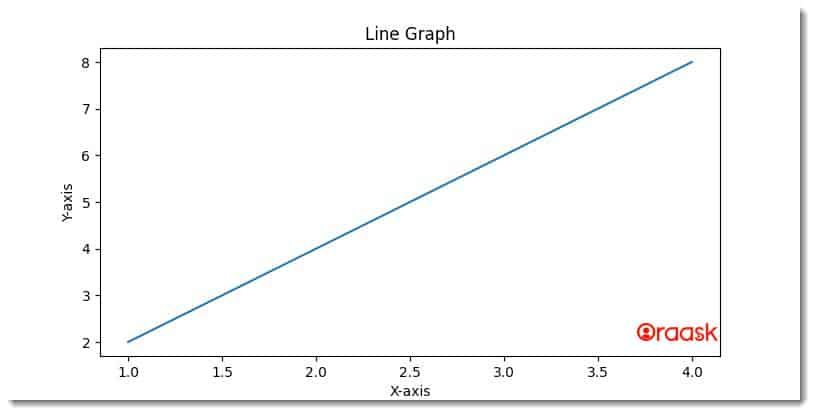
In this example, we used the “rcParams” dictionary to set the default figure size to be 8 inches in width and 4 inches in height. We then plotted a simple line graph and added a title and axis labels to the plot. Finally, we displayed the plot using the “show()” function.
By setting the “figure.figsize” property in “rcParams“, we can set the default figure size for all plots in our code. This can be convenient when we want to ensure that all our plots have a consistent size.
It’s important to note that the “rcParams” dictionary is global, so any changes we make will affect all subsequent plots. If we want to set the figure size for a specific plot, we may prefer to use the figure() or subplots() functions as demonstrated in the previous sections.
Conclusion:
In this article, we discussed several ways to change the figure size in Matplotlib, a popular data visualization library in Python. We learned how to set the figure size using the “Figure()” function, the “subplots()” function, and rcParams. Each method offers its own benefits and drawbacks, and the choice of which method to use ultimately depends on the specific use case.
The “figure()” function helps create a single plot and customize its size and other properties. The “subplots()” function is ideal for creating multiple plots in a single figure and setting their size simultaneously. Lastly, “rcParams” provides a way to set default figure properties globally, which is convenient when we want all our plots to be the same size.
In summary, setting the figure size in Matplotlib is a simple but essential step in creating compelling visualizations. Using the techniques we discussed in this article, we can ensure that our plots have the appropriate size and dimensions to effectively communicate our data insights to our audience.


