How Can We Help?
Introduction
Pandas is an open-source data manipulation and analysis library built on NumPy. It is one of the Python ecosystem’s most widely used data analysis libraries and provides a powerful data manipulation and analysis toolset. One of the critical features of Pandas is its support for aggregations, which allows users to perform various types of operations on a data frame or Series to produce summarized data. In this article, we will explore the various aggregations that Pandas supports and how they can process and analyze data.
- Introduction
- What is Pandas Aggregation?
- Built-In Pandas Aggregation Functions
- Python Pandas Aggregation Functions list
- Custom Pandas Aggregation Functions
- Applying Aggregations to Subsets of Data
- Group and Aggregate Data In Pandas Using groupby, pivot_table, crosstab Functions
- The groupby Function
- The pivot_table Function
- The crosstab Function
- Conclusion
In this article, we shall learn about aggregation functions. We shall learn both about custom functions as well as built-in functions.
What is Pandas Aggregation?
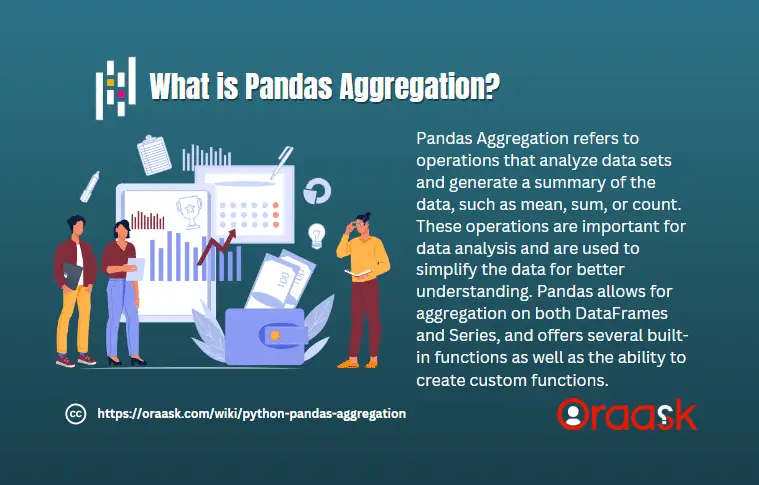
Aggregations are operations that perform some type of computation or transformation on a data set and produce a data summary. For example, an aggregation could compute the set’s mean, sum, or count. Aggregations are an essential part of data analysis and are used to summarize and condense data into a manageable form that can be more easily understood and analyzed.
Aggregations in Pandas can be performed on both DataFrames and Series. A data frame is a two-dimensional data structure storing data in rows and columns. A Series is a one-dimensional data structure that can store data in a single column or row.
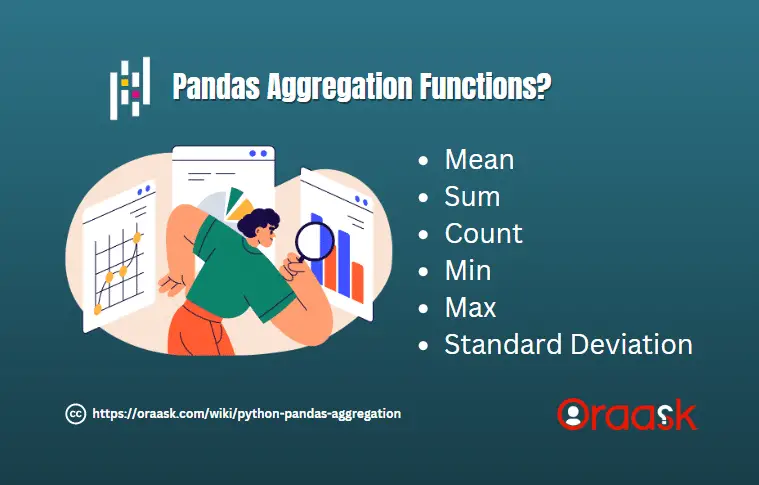
Pandas provide several built-in aggregation functions that can be used to perform operations on data. Some common aggregations include mean, sum, count, min, max, and standard deviation.
In addition to these built-in functions, Pandas also supports custom aggregation functions, allowing users to perform their computations on data.

Built-In Pandas Aggregation Functions
Built-in Pandas Aggregation Functions are pre-defined operations that can be applied to DataFrames and Series objects in Python to compute summary statistics such as mean, sum, count, min, max, and standard deviation. These functions provide a fast and flexible way to analyze data sets.
Python Pandas Aggregation Functions list
- Mean
- Sum
- Count
- Min
- Max
- Standard Deviation

Pandas Mean Aggregation Function:
The mean aggregation is used to compute the average of a set of values. It is calculated by summing up all the values in the data set and dividing by the number of values. The mean is a commonly used aggregation that provides a good indicator of the central tendency of a data set.
Example (1)
import pandas as pd
df = pd.DataFrame({'A': [1, 2, 3, 4, 5], 'B': [5, 4, 3, 2, 1]})
print(df.mean())
Output:
A 3.0
B 3.0
dtype: float64
Pandas Sum Aggregation Function
The sum aggregation is used to compute the sum of a set of values. The sum is calculated by adding up all the values in the data set. The sum is a commonly used aggregation that indicates a set’s total amount of data.
Example (2)
import pandas as pd
df = pd.DataFrame({'A': [1, 2, 3, 4, 5], 'B': [5, 4, 3, 2, 1]})
print(df.sum())
Output:
A 15
B 15
dtype: int64
Pandas Count Aggregation Function
Count aggregation is used to compute the number of values in a data set. The count is calculated by counting the number of values in the data set. The count is a commonly used aggregation that provides a good indicator of the size of a data set.
Example (3)
import pandas as pd

df = pd.DataFrame({'A': [1, 2, 3, 4, 5], 'B': [5, 4, 3, 2, 1]})
print(df.count())
Output:
A 5
B 5
dtype: int64
Pandas Min Aggregation Function
The min aggregation is used to compute the minimum value in a data set. The min is calculated by finding the smallest value in the data set. The min is a commonly used aggregation that provides a good indicator of the lower bound of a data set.
Example (4)
import pandas as pd
df = pd.DataFrame({'A': [1, 2, 3, 4, 5], 'B': [5, 4, 3, 2, 1]})
print(df.min())
Output:
A 1
B 1
dtype: int64
Pandas Max Aggregation Function
The max aggregation is used to compute the maximum value in a data set. The max is calculated by finding the largest value in the data set. The max is a commonly used aggregation that provides a good indicator of the upper bound of a data set.
Example (5)
import pandas as pd
df = pd.DataFrame({'A': [1, 2, 3, 4, 5], 'B': [5, 4, 3, 2, 1]})
print(df.max())
Output:
A 5
B 5
dtype: int64
Pandas Standard Deviation Aggregation Function
The standard deviation aggregation is used to compute the standard deviation of a set of values. The standard deviation is calculated by finding the square root of the variance of the data set. The standard deviation is a commonly used aggregation that provides a good indicator of the spread of a data set.
Example (6)
import pandas as pd
df = pd.DataFrame({'A': [1, 2, 3, 4, 5], 'B': [5, 4, 3, 2, 1]})
print(df.std())
Output:
A 1.581139
B 1.581139
dtype: float64
Custom Pandas Aggregation Functions
In addition to the built-in aggregation functions, Pandas also provides support for custom aggregation functions. Custom aggregation functions allow users to perform their computations on data.
To create a custom aggregation function, a user must define a function that takes in a Series and returns a single value. This function can then be passed to the agg method on a DataFrame or Series to perform the aggregation.
Example (7)
import pandas as pd
def custom_agg(series):
    return sum(series) / len(series)
df = pd.DataFrame({'A': [1, 2, 3, 4, 5], 'B': [5, 4, 3, 2, 1]})
print(df.agg(custom_agg))
Output:
A 3.0
B 3.0
dtype: float64
Applying Aggregations to Subsets of Data
In some cases, performing aggregations on only a subset of data may be necessary. Pandas provide several options for performing aggregations on subsets of data.
One option is to use the groupby method to group data based on one or more columns and then perform an aggregation on each group. The groupby method returns a DataFrameGroupBy object that can be used to perform aggregations on each group.
Example (8)
Import pandas as pd
df = pd.DataFrame({'A': [1, 2, 3, 4, 5], 'B': [5, 4, 3, 2, 1], 'C': ['a', 'b', 'a', 'b', 'a']})
grouped = df.groupby('C')
print(grouped.mean())
Output:
A B
C
a 3.0 3.0
b 3.0 3.0
Another option is to use boolean indexing to select a subset of data based on a condition and then perform an aggregation on the selected data.
Example (9)
import pandas as pd
df = pd.DataFrame({'A': [1, 2, 3, 4, 5], 'B': [5, 4, 3, 2, 1]})
print(df[df['A'] > 2].mean())
Output:
A 4.0
B 3.0
dtype: float64
Group and Aggregate Data In Pandas Using groupby, pivot_table, crosstab Functions
The groupby(), pivot_table(), and crosstab() functions in Pandas are used to group and aggregate data in different ways.
- The groupby() function is used to group data based on one or more columns and then apply aggregation functions to the grouped data. This function splits the data into groups based on the values in one or more columns and then calculates statistics for each group. The aggregation functions can be built-in functions such as mean, sum, count, or custom functions defined by the user.
- The pivot_table() Function creates a pivot table, a two-dimensional data structure used to summarize and aggregate data. A pivot table is a multi-indexed table that can be used to calculate and visualize data differently. The pivot_table() Function creates a pivot table from a DataFrame by specifying one or more columns to group the data and one or more columns to aggregate the data. The resulting pivot table can compare data distribution between multiple categories.
- The crosstab() function creates a cross-tabulation table, which shows the frequency of occurrences between two or more variables. The crosstab() function is particularly useful when comparing the frequency of occurrences between two categorical variables. The resulting cross-tabulation table shows the frequency of occurrences for each combination of values in the two variables.
The groupby Function
The groupby function groups data based on one or more columns. This function returns a DataFrameGroupBy object that can be used to perform aggregations on each group. The groupby function is beneficial when you want to perform the same aggregation on multiple data groups.
Example (10)
import pandas as pd
df = pd.DataFrame({'A': [1, 2, 3, 4, 5], 'B': [5, 4, 3, 2, 1], 'C': ['a', 'b', 'a', 'b', 'a']})
grouped = df.groupby('C')
print(grouped.mean())
Output:
A B
C
a 3.0 3.0
b 3.0 3.0
Explanation:
In this example, we first create a DataFrame with columns ‘A‘, ‘B‘, and ‘C‘. We then use the groupby() function to group the data based on column ‘C‘. The mean() method is then called on the DataFrameGroupBy object to perform the mean aggregation on each group. The output shows the mean of columns ‘A‘ and ‘B‘ for each group defined by column ‘C‘.
The pivot_table Function
The pivot_table() function creates a pivot table from a data frame. A pivot table is a table that summarizes data by grouping data along one or more columns and aggregating the data in another column. The pivot_table() function is particularly useful when comparing aggregated data across multiple categories.
Example (11)
import pandas as pd
df = pd.DataFrame({'A': [1, 2, 3, 4, 5], 'B': [5, 4, 3, 2, 1], 'C': ['a', 'b', 'a', 'b', 'a']})
pivot = df.pivot_table(index='C', values='A', aggfunc='mean')
print(pivot)
Output:
A
C
a 3.0
b 3.0
Explanation:
In this example, we first create a DataFrame with columns ‘A‘, ‘B‘, and ‘C‘. We then use the pivot_table() function to create a pivot table with column ‘C‘ as the index, column ‘A‘ as the values, and the mean aggregation function. The output shows the mean of column ‘A‘ for each group defined by column ‘C‘.
The crosstab Function
The crosstab() Function creates a cross-tabulation table from a data frame. A cross-tabulation table summarizes the frequency of occurrences between two or more variables. The crosstab() function is particularly useful when comparing the frequency of occurrences between two categorical variables.
Example (12)
import pandas as pd
df = pd.DataFrame({'A': [1, 2, 3, 4, 5], 'B': ['a', 'b', 'a', 'b', 'a'], 'C': ['x', 'x', 'y', 'y', 'y']})
crosstab = pd.crosstab(index=df['B'], columns=df['C'], margins=True)
print(crosstab)
Output:
C x y All
B
a 0 2 2
b 2 2 4
All 2 4 6
Explanation:
In this example, we first create a DataFrame with columns ‘A‘, ‘B‘, and ‘C‘. We then use the crosstab() function to create a cross-tabulation table with column ‘B‘ as the index and column ‘C‘ as the columns. The margins argument is set to True to include the row and column sums in the output. The output shows the frequency of occurrences between columns ‘B‘ and ‘C‘.
Conclusion
Pandas aggregations are a powerful tool for summarizing and aggregating data. With the built-in aggregation functions and the ability to create custom aggregation functions, Pandas provides a comprehensive solution for performing aggregations on data. Additionally, the ability to perform aggregations on subsets of data further expands the capabilities of Pandas aggregations. With these features, Pandas aggregations are a valuable data analysis and manipulation tool.


