Introduction:
In this article we’ll demonstrate How to debug a standard API in oracle apps.
A lot of us struggling when face an error that is raised by standard API. Some of these errors are obvious and some are not. At some point we have to open the standard API’s to investigate more to identify why our API is returned an error or “p_return_status = E”.
In this tutorial we are about to run previous API example “Create move order using API in oracle apps R12“. Instead of create new or duplicate example. All we have to do is intentionally we will specify wrong inventory_item_id to the API in the second line of the move order to let the API returned with error instead of success. So this tutorial will apply on your API if an API returned with error.
Ok let’s dive into the details:
Prerequisites:
Inventory API returned with error.
Goal:
Enable debug inventory standard API’s in oracle apps
Steps:
Note : This tutorial will apply on inventory API:
1. Find a valid path for log file
Run the query below to find a valid path that we want to create our log file inside.
SELECT value FROM v$parameter WHERE name = 'utl_file_dir';- On windows server it would be something like:
c:\temp\ - On linux server it would be something like :
/usr/tmp/
2. Enable Inventory Debug from application
- Navigate to system administrator > Profiles > System
- Query for INV%debug% at the appropriate level — For example, user level:
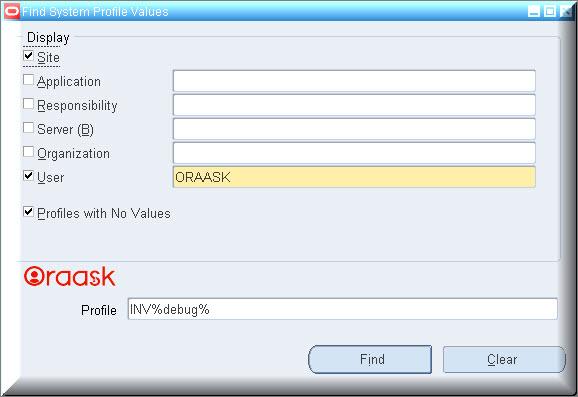
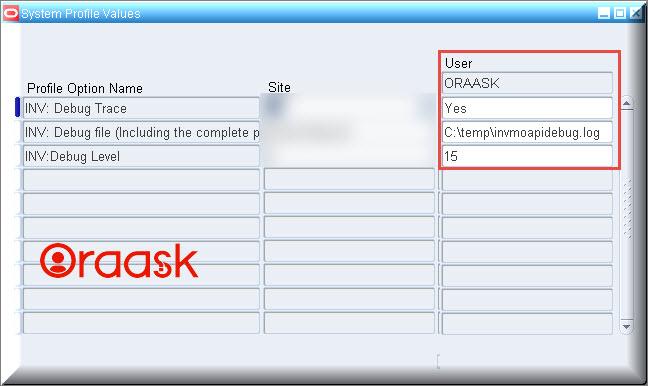
- Enable INV Debug profiles at User level for the user who would be running the API:
For example:
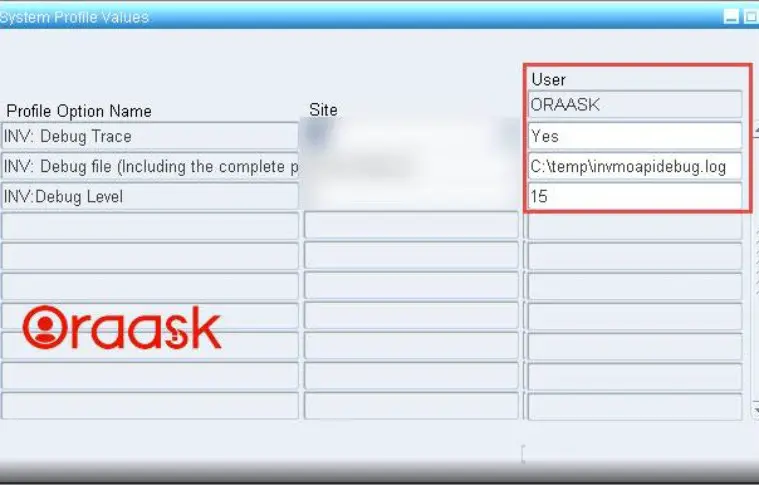
INV:Debug Trace = YES
INV:Debug level = 15
INV: Debug File = C:\temp\invmoapidebug.log
About the Profiles:
There are three profiles related to inventory debug. They are used together
INV: Debug Trace: set Yes to turn on the debug functionality. Set No to turn off the debug functionality.
INV:Debug Level: set 0 , will print the summary debug messages.
– Set to 11, to print the detail debug messages.
– Set to 15 for more details
– Set to 102 for maximum information (may create a VERY large log file)
INV: Debug file: C:\temp\invmoapidebug.log consists of two parts.
C:\temp\ :- is the full path that we got from executing above query in step 2. This path is for windows EBS server, and you will find something like : /usr/tmp/ :- for linux EBS server.
invmoapidebug.log :- is your log file name, give it the name you want.
Disabling Debug:
To disable debug, set the profile to no: INV: Debug Trace: No
- Navigate to system administrator > Profiles > System.
- Query for INV%ebug% at the appropriate level — For example, user level.
- Change the debug trace to no:
INV: Debug Trace: No
3. Initialize applications context
Add the below code before the API is called in the SQL script. This will initialize applications context, and will use the values of the debug profiles set for this user.
fnd_global.apps_initialize (user_id => 1013415, -- User ID: 1013415 Is For ORAASK USER_ID
                              resp_id => 20539, -- Responsibility ID: This is my inventory responsibility.
                              resp_appl_id => 401);
4. Execute the API from the SQL script
this will create the debug log file with the file name as provided in the profile “INV: Debug File” on corresponding path.
5. Check the log file in the directory
Notice your file in directory you have specified on step 3 has been created.
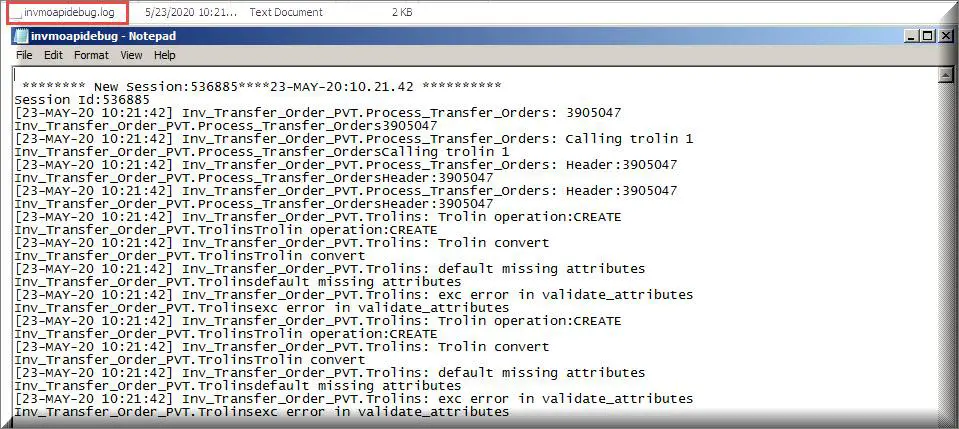
That’s all we have in this article, at this point you will be able to read the steps that the standard API had followed, So we can figure out the issue and where it happened exactly.
Sources :
Doc ID 869386.1
In this article, we have demonstrated How to debug a standard API in oracle apps.
Hopefully, it was clear and concise.
Please don’t test this on production environment, instead test it on test environment.
It takes more than 4 hours to create 2 minutes reading article.
JUST SHARE THIS ARTICLE
