How Can We Help?
Matplotlib is a python library that is used for data visualization. We can use Matplotlib to plot the graphs, create animations, etc. One of the most critical components of the Matplotlib plot is the legends. The legend is an area describing the elements of the graph. When multiple plots are given to a single figure, then we need to use it to distinguish the plots from one another. Additionally, this helps to make the plot more informative.
Can I change the matplotlib legend size? Yes, you can change the font size of a Matplotlib legend by using the fontsize parameter. Assigning a value to the fontsize parameter, such as fontsize=”20″, will adjust the size of the legend in the plot.
In this article, we will understand how to change the font of the legends in Matplotlib, including the size, style, font family color, etc.
Prerequisite
Before we start our coding part, we need to have the following libraries installed in our local machine where we will code:
Numpy, MatplotlibIn case you have not installed them, then follow the following steps:
o If you are a windows user, then open the PowerShell terminal and run the following command:
pip install matplotlib numpyo If you are a Linux or a macOS user, then run the following commands in the bash terminal:
pip install matplotlib numpyChanging Matplotlib Legend Font Size
Changing the font size in Matplotlib is relatively simple in our library. We need to use the font size attribute of the plt.legend() size function of Matplotlib. Note that this will change the size of the entire legend.
Example (1)
# Import all the necessary libraries and packages in the code
import matplotlib.pyplot as plt
import numpy as np
# Creating a user-defined function named change_legend()
def change_legend(x, y1, y2):
    # Creating a figure object
    fig = plt.figure(figsize=(9, 9))
    # Plotting the y=sin(x) graph
    plt.plot(x, y1, color='g')
    # Plotting the y=cos(x) graph
    plt.plot(x, y2, color='red')
    # Defining the legend along the x-axis
    plt.xlabel("x-axis")
    # Defining the legend along the y-axis
    plt.ylabel("y-axis")
    # Changing text font size in legend
    plt.legend(['y = sin(x) ', "y = cos(x) "], fontsize=20, loc="upper right")
    # Displaying the plot
    plt.show()
# Creating the main() function
def main():
    # Creating the value of x coordinate for the data points
    x = np.arange(1, 10, 0.1)
    # Creating the value of y coordinate for the data points of the first plot
    y1 = np.sin(x)
    # Creating the value of y coordinate for the data points of the second plot
    y2 = np.cos(x)
    # Calling the change_legend() function
    change_legend(x, y1, y2)
# Calling the main() function.
if __name__ == '__main__':
    main()
Output:
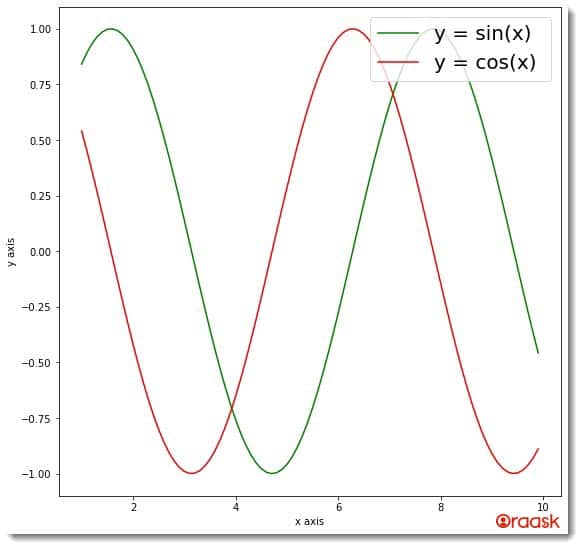
Explanation:
- First, we imported all the necessary libraries and packages in our code using the import statement of python. We used the aliasing names for importing for convenience in writing the codes in our program.
- Next, we created a user-defined function named change_legend(). This is a void function, and it takes three parameters, namely x, y1, and y2. Under this function, we first created the figure object using the figure() function of matplotlib. We specified the size of the figures using the figsize attribute of the Matplotlib library.
- Next, we plotted the figures using the plot() function of Matplotlib. Since we have two different plots, we used the function twice in our code. We specified different colors for the graphs for better visibility of the graphs.
- Next, we used the xlabel() and the ylabel() functions to provide the labels for the plots. We used the legend() function of Matplotlib to provide the legend to the plot. The legend() function takes a list-like object inside which the elements are any string or number, which defines the individual plots. We used the fontsize attribute to define the font size of the legend in the plot. We also used another attribute named loc to determine the location of the legend in the figure.
- We used the plt.show() function to display the graph. This is, however, optional in Jupyter Notebook. Users can skip this function there. However, we strongly recommend that the users use the function.
- After the chage_legend() function, we created the main() function. This is the main driving code of the program. Under this function, we first created the data points. We used the arrange() function of the Numpy library to define the x coordinates of the data points. We used the np.sin() function to get the sine and the np.cos() function to get the cosine values of the corresponding data points. We called the change_legend() function with appropriate arguments in the code.
- Finally, we called the main() function using the following lines of codes:
if __name__ == ‘__main__’:
main()
Check This: Article on How to Change Figure Size in Matplotlib if you want to know more about Transform your data visualizations with Matplotlib’s figure size adjustment. Discover how to resize figures with ease.
Using The Prop Attribute
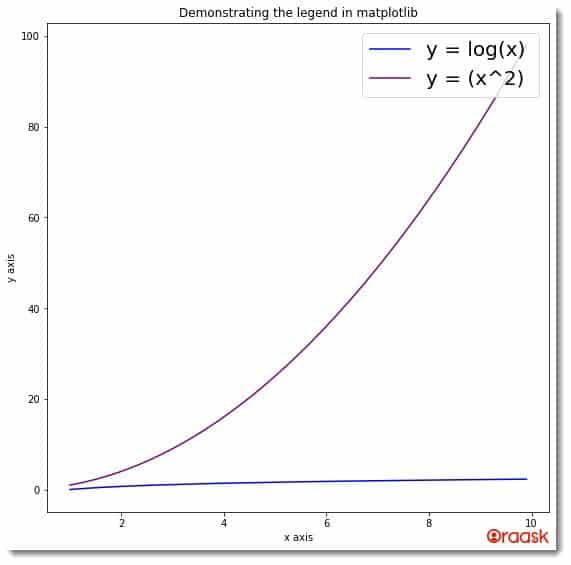
Another method to change the font size of the matplotlib legend or, in other words, to change the plt legend font size is to use the prop attribute of matplotlib. The attribute takes JSON-like data as an argument. The syntax to use the attribute is as follows:
prop = {'size' : <desired_size>}We can pass the value of the desired font size in place of the desired_size.
Example (2)
# Import all the necessary libraries and packages in the code
import matplotlib.pyplot as plt
import numpy as np
# Creating a user-defined function named change_legend()
def change_legend(x, y1, y2):
    # Creating a figure object
    fig = plt.figure(figsize=(9, 9))
    # Plotting the y=sin(x) graph
    plt.plot(x, y1, color='blue')
    # Plotting the y=cos(x) graph
    plt.plot(x, y2, color='purple')
    # Defining the legend along the x-axis
    plt.xlabel("x-axis")
    # Defining the legend along the y-axis
    plt.ylabel("y-axis")
    # Changing text font size in legend
    plt.legend(['y = log(x) ', "y = (x^2) "], prop = {'size' : 20}, loc="upper right")
    # Defining the title of the plot
    plt.title("Demonstrating the legend in matplotlib")
    # Displaying the plot
    plt.show()
# Creating the main() function
def main():
    # Creating the value of x coordinate for the data points
    x = np.arange(1, 10, 0.1)
    # Creating the value of y coordinate for the data points of the first plot
    y1 = np.log(x)
    # Creating the value of y coordinate for the data points of the second plot
    y2 = np.power(x,2)
    # Calling the change_legend() function
    change_legend(x, y1, y2)
# Calling the main() function.
if __name__ == '__main__':
    main()
Output:
Using The rc() Function
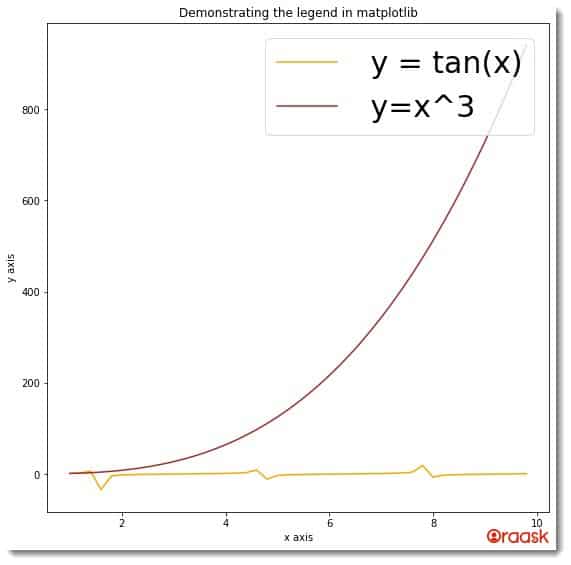
Another function that we can use to change the legend size is the rc() function. To use this function, we need to adopt the following method:
- First, make the legends using the legend() function.
- Next, call the rc() function and specify the font size using the fontsize attribute to change the legend font size.
Example (3)
# Import all the necessary libraries and packages in the code
import matplotlib.pyplot as plt
import numpy as np
# Creating a user-defined function named change_legend()

def change_legend(x, y1, y2):
    # Creating a figure object
    fig = plt.figure(figsize=(9, 9))
    # Plotting the y=sin(x) graph
    plt.plot(x, y1, color='orange' ,label=" y = tan(x)")
    # Plotting the y=cos(x) graph
    plt.plot(x, y2, color='brown', label=" y=x^3 ")
    # Defining the legend along the x-axis
    plt.xlabel("x-axis")
    # Defining the legend along the y-axis
    plt.ylabel("y-axis")
    # Changing text font size in legend
    plt.legend(loc="upper right")
    # Defining the title of the plot
    plt.title("Demonstrating the legend in matplotlib")
    plt.rc('legend', fontsize = 30)
    # Displaying the plot
    plt.show()
# Creating the main() function
def main():
    # Creating the value of x coordinate for the data points
    x = np.arange(1, 10, 0.2)
    # Creating the value of y coordinate for the data points of the first plot
    y1 = np.tan(x)
    # Creating the value of y coordinate for the data points of the second plot
    y2 = np.power(x,3)
    # Calling the change_legend() function
    change_legend(x, y1, y2)

# Calling the main() function.
if __name__ == '__main__':
    main()
Output:
Change The Font Family
Matplotlib allows us to customize every small task. We can use the prop argument in the legend function to define the font family, style, weight, stretch, and even the variant of the font family.
The props will take JSON-like data as follows:
{
  "weight": "bold",
  "stretch": "normal",
  "name": "Comic Sans MS",
  "style": "normal",
  "size": "scalable",
  "variant": "normal"
},
There are a lot more associated with it. However, these are the most commonly used in Matplotlib. You can also check the Matplotlib documentation for information about the other properties of Matplotlib legend font.
Check This: There is a full guide on Matplotlib Legend if you want to know more about legends and how to use them.
Example (4)
# Import all the necessary libraries and packages in the code
import matplotlib.pyplot as plt
import numpy as np
# Creating a user-defined function named change_legend()
def change_legend(x, y1, y2):
    # Creating a figure object
    fig = plt.figure(figsize=(9, 9))
    # Plotting the first graph
    plt.scatter(x, y1, color='red', label=" First scatter plot ")
    # Plotting the second graph
    plt.scatter(x, y2, color='blue', label=" Second scatter plot ")
    # Defining the legend along the x-axis
    plt.xlabel("x-axis")
    # Defining the legend along the y-axis
    plt.ylabel("y-axis")
    # Changing text font size in legend
    plt.legend(loc="upper right", prop={
               'family': 'Comic Sans MS', 'weight': 'bold', "size": 20, 'stretch': 'normal'})
    # Defining the title of the plot
    plt.title("Demonstrating the legend in matplotlib")
    # Displaying the plot
    plt.show()
# Creating the main() function
def main():
    # Creating the value of x coordinate for the data points
    x = np.random.randint(1, 100, 100)
    # Creating the value of y coordinate for the data points of the first plot
    y1 = np.random.randint(1, 100, 100)
    # Creating the value of y coordinate for the data points of the second plot
    y2 = np.random.randint(1, 100, 100)
    # Calling the change_legend() function
    change_legend(x, y1, y2)
# Calling the main() function.
if __name__ == '__main__':
    main()
Output:

Notice the font family, style, etc. Have changed in the plot.
Using the font_manager Module to Change Matplotlib Legend Size
Our library also allows us to change the legends’ size, style, etc., using the font_manager module of the Matplotlib library. Like the props attribute, this function takes similar arguments.
{
  "weight": "bold",
  "stretch": "normal",
  "name": "Comic Sans MS",
  "style": "normal",
  "size": "scalable",
  "variant": "normal"
},
Example (5)
# Import all the necessary libraries and packages in the code
import matplotlib.pyplot as plt
import numpy as np
import matplotlib.font_manager as font_manager
# Creting a user-defined function named change_legend()
def change_legend(x, y1, y2):
    # Creating a figure object
    fig = plt.figure(figsize=(9, 9))
    # Plotting the first graph
    plt.scatter(x, y1, color='orange', label=" First scatter plot ")
    # Plotting the second graph
    plt.scatter(x, y2, color='brown', label=" Second scatter plot ")
    # Defining the legend along the x-axis
    plt.xlabel("x-axis")
    # Defining the legend along the y-axis
    plt.ylabel("y-axis")
    # Defining the custom font using the font_manager function
    font = font_manager.FontProperties(family='Comic Sans MS',
                                   weight='bold',
                                   size=30)
    # Changing text font size in legend
    plt.legend(loc="upper right", prop=font )
    # Defining the title of the plot
    plt.title("Demonstrating the legend in matplotlib")
    # Displaying the plot
    plt.show()
# Creating the main() function
def main():
    # Creating the value of x coordinate for the data points
    x = np.random.randint(1, 10, 100)
    # Creating the y coordinate value for the data points of the first plot
    y1 = np.random.randint(1, 10, 100)
    # Creating the value of y coordinate for the data points of the second plot
    y2 = np.random.randint(1, 10, 100)
    # Calling the change_legend() function
    change_legend(x, y1, y2)
# Calling the main() function.
if __name__ == '__main__':
    main()
Output:

How To Change The Font Style In Matplotlib Legend
Matplotlib allows us to change the style of the legends using the props attribute, font_manager() function, etc. Both syntaxes are pretty similar, as we have seen in previous sections. Here we will see how to change the font style using the font_manage() function. Take changing font style using the props as an exercise.
Example (6)
# Import all the necessary libraries and packages in the code
import matplotlib.pyplot as plt
import numpy as np
import matplotlib.font_manager as font_manager
# Creating a user-defined function named change_legend()


def change_legend(x, y1, y2):
    # Creating a figure object
    fig = plt.figure(figsize=(9, 9))
    # Plotting the first graph
    plt.bar(x-2.5, y1, color='orange', label=" First barplot " , width=5)
    # Plotting the second graph
    plt.bar(x+2.5, y2, color='brown', label=" Second bar plot " , width=5)
    # Defining the legend along the x-axis
    plt.xlabel("x-axis")
    # Defining the legend along the y-axis
    plt.ylabel("y-axis")
    # Defining the custom font using the font_manager function
    font = font_manager.FontProperties(family='Times New Roman',
                                   weight='bold', style='italic',
                                   size=30)
    # Changing text font size in legend
    plt.legend(loc="upper right",prop=font )
    # Defining the title of the plot
    plt.title("Demonstrating the legend in matplotlib")
    # Displaying the plot
    plt.show()
# Creating the main() function
def main():
    # Creating the value of x coordinate for the data points
    x = np.array([int(x) for x in range(1,100,10)])
    # Creating the value of y coordinate for the data points of the first plot
    y1 = np.array([23,56,35,64,83,244,234,34,67,56])
    # Creating the value of y coordinate for the data points of the second plot
    y2 = np.array([23,54,45,3,56,354,34,55,34,35])
    # Calling the change_legend() function
    change_legend(x, y1, y2)
# Calling the main() function.
if __name__ == '__main__':
    main()
Output:
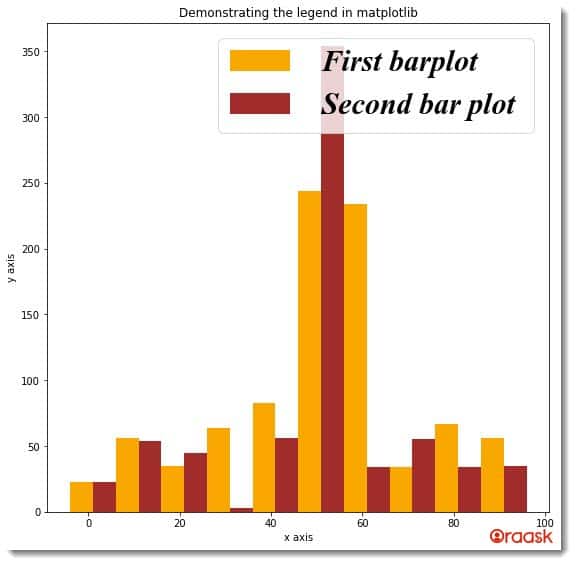
Notice that we have changed the style of the legend texts to italic. We also changed the font weight of the texts into bold.
How To Change The Color Of Matplotlib Legend
Matplotlib also allows us to change the legend and the texts of the legends. If we want to change the color of the entire legend, then we need to use the facecolor attribute of Matplotlib. However, if you want to change the color of the texts only then, you can use an iterative method. The method is as follows:
- First, you need to name the legend declaration using a variable.
- Then access the texts of the legend text using the get_texts() method.
- Use the function set_color() to change the color of the texts.
Below is the method to change the face color of the Matplotlib legend
Example (7)
# Import all the necessary libraries and packages in the code
import matplotlib.pyplot as plt
import numpy as np
import matplotlib.font_manager as font_manager
# Creating a user-defined functions named change_legend()
def change_legend(x, y1, y2):
    # Creating a figure object
    fig = plt.figure(figsize=(9, 9))
    # Plotting the first graph
    plt.plot(x, y1, color='orange', label=" First plot ")
    # Plotting the second graph
    plt.plot(x, y2, color='brown', label=" Second plot " )
    # Defining the legend along the x-axis
    plt.xlabel("x-axis")
    # Defining the legend along the y-axis
    plt.ylabel("y-axis")
    # Defining the custom font using the font_manager function
    font = font_manager.FontProperties(family='DejaVu Sans',
                                   weight='bold', style='italic',
                                   size=30)
    # Changing text font size in legend
    leg=plt.legend(loc="upper right",prop=font ,facecolor="yellow")
    # Defining the title of the plot
    plt.title("Demonstrating the legend in matplotlib")
    # Displaying the plot
    plt.show()
# Creating the main() function
def main():
    # Creating the value of x coordinate for the data points
    x = np.arange(-10,10,0.1)
    # Creating the value of y coordinate for the data points of the first plot
    y1 = 1/(1+np.exp(-x))
    # Creating the value of y coordinate for the data points of the second plot
    y2 = np.exp(-x)
    # Calling the change_legend() function
    change_legend(x, y1, y2)
# Calling the main() function.
if __name__ == '__main__':
    main()
Output:
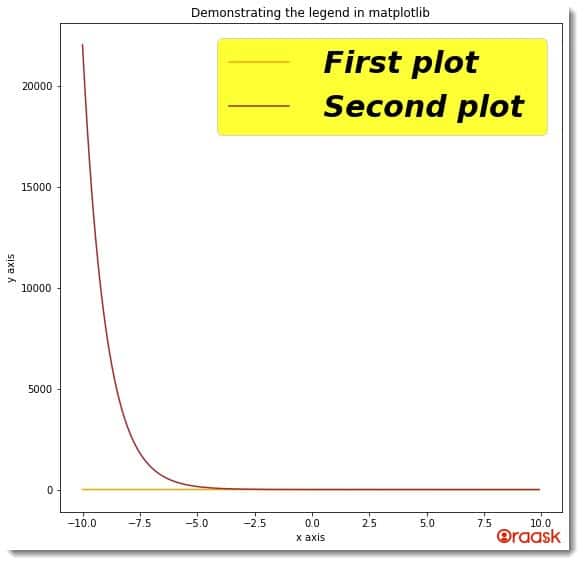
Check This: There is a full guide on Matplotlib Colors if you want to know more about colors in matplotlib.
Below is the approach to changing the text color of legends
Example (8)
# Import all the necessary libraries and packages in the code
import matplotlib.pyplot as plt
import numpy as np
import matplotlib.font_manager as font_manager
# Creating a user-defined functions named change_legend()
def change_legend(x, y1, y2):
    # Creating a figure object
    fig = plt.figure(figsize=(9, 9))
    # Plotting the first graph
    plt.plot(x, y1, color='orange', label=" First plot ")
    # Plotting the second graph
    plt.plot(x, y2, color='brown', label=" Second plot " )
    # Defining the legend along the x-axis
    plt.xlabel("x-axis")
    # Defining the legend along the y-axis
    plt.ylabel("y-axis")
    # Defining the custom font using the font_manager function
    font = font_manager.FontProperties(family='Times New Roman',
                                   weight='bold', style='italic',
                                   size=30)
    # Changing text font size in legend
    leg=plt.legend(loc="upper right",prop=font)
    # Iterating the legend texts
    for legend_text in leg.get_texts():
        legend_text.set_color("purple")
    # Defining the title of the plot
    plt.title("Demonstrating the legend in matplotlib")
    # Displaying the plot
    plt.show()
# Creating the main() function
def main():
    # Creating the value of x coordinate for the data points
    x = np.arange(-10,10,0.1)
    # Creating the value of y coordinate for the data points of the first plot
    y1 = np.sin(x)+np.cos(x)
    # Creating the value of y coordinate for the data points of the second plot
    y2 = np.sin(x)
    # Calling the change_legend() function
    change_legend(x, y1, y2)
# Calling the main() function.
if __name__ == '__main__':
    main()
Output:
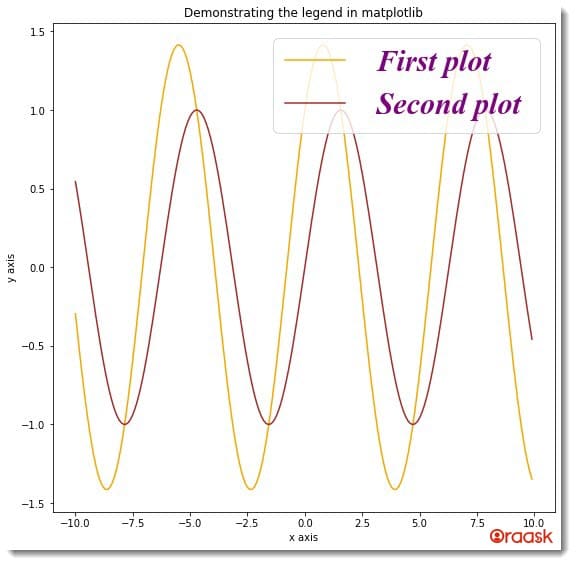
In the above code, under the change_legend() function, we have first named the legend declaration as a leg. Next, we used the get_texts() method to access the texts of the legends. We have used the iteration method with it to get all the texts. And with each iteration, we have set the color to the texts using the set_color() function.
Conclusion:
In this article, we have understood how to change the style, fonts, and color of the legend section of python matplotlib. We used many different attributes and functions of matplotlib to achieve the same. We also used the font_manager() function of matplotlib to change the font size, style, etc. of matplotlib.
Although we have covered the most critical aspects of the topic, we highly recommend that the users look up the python matplotlib documentation for more information about the associated attributes and functions.


