How Can We Help?
Matplotlib allows us the flexibility to customize even minute details of the plot. Programmers often need to change the line width, whether statically or based on the values of the coordinates dynamically. This article will explain how to change the line width in matplotlib.
Prerequisite
Before we proceed with the code, you should have the following libraries installed on your local machine:
Matploltib, numpy
If you haven’t installed them yet, then install them using the following instructions:
[adinserter block=”1″]
If you are a windows user, then open the PowerShell and if you are a macOS or Linux user, then open the bash terminal and run the following codes:
pip install matplotlib numpyUsing The Linewidth Attribute of The Plot Function
We can easily change the line width using the linewidth attribute available in the plot function of matplotlib. The function takes a float as its valid value. However, this function is entirely optional to use. If the user skips passing any value to this argument, then by default, matplotlib will assign 1 to its value.
Example (1)
[adinserter block=”2″]
# Import all the required libraries and modules in the code
import matplotlib.pyplot as plt
import numpy as np
# Creating a user-defined function named lim_change


def width_change(x, y1, y2, y3, y4, y5,y6,y7):
    # Creating the figure object
    fig = plt.figure(figsize=(9, 9))
    # Plotting the figure
    plt.plot(x, y1, color='orange', linewidth=1)
    plt.plot(x, y2, color='blue', linewidth=2)
    plt.plot(x, y3, color='red', linewidth=3)
    plt.plot(x, y4, color='cyan', linewidth=4)
    plt.plot(x, y5, color='yellow', linewidth=5)
    plt.plot(x, y6, color='green', linewidth=6)
    plt.plot(x, y7, color='violet', linewidth=7)
    # Defining the title for the plot
    plt.title("Demonstrating how to change line width in matplotlib")
    # Defining the label along the x-axis
    plt.xlabel("x coordinates")
    # Defining the label along the y-axis
    plt.ylabel("y coordinates")
    # Displaying the plot
    plt.show()
# Creating the main() function


def main():
    # Creating the x coordinates of the data points
    x = np.arange(0, 10, 0.1)
    # Creating the y coordinates of the data points
    y1 = x+1
    y2 = x+2
    y3 = x+3
    y4 = x+4
    y5 = x+5
    y6 = x+6
    y7 = x+7
    # Calling the lim_change function
    width_change (x, y1, y2, y3, y4, y5,y6,y7)


# calling the main function
if __name__ == '__main__':
    main()
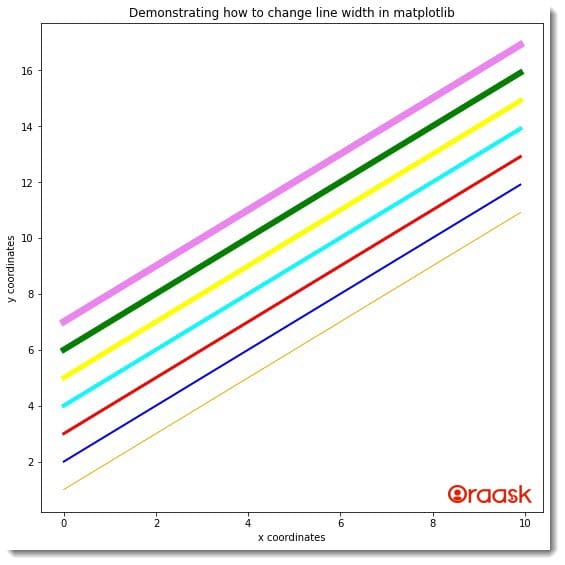
Output:

Explanation:
- First, we imported all the necessary libraries and packages in the code using the import statement of python. We used the technique of aliasing for convenience in the coding part.
- Next, we created a user-defined function named width_change. Under this function, we first defined the figure object using the figure function of python matplotlib. We defined the figure area’s size using this function’s figsize attribute.
- Next, we used the plot function of matplotlib to plot the figures. We called the plot function 7 times to plot 7 different plots. In each plot function, we have used the color attribute to define different colors in the plot. We used the linewidth attribute to define different line widths for the plots.
- We used the title function to define the title of the plot. We used the xlabel and the ylabel functions to define the labels along the x and y-axis.
- We also used the show function to display the plot. However, this is optional to use in Jupyer Notebook.
- After the width_change function, we defined the main function. This is the driving code of our program. Under this function, we defined all the data points required for the plot. We used the arange function of the numpy library to create the data points. The arange function takes three parameters: start, stop, and iterating step. The start defines the number with which the iteration should start. Stop defines the number up to which the iteration should run, and the step is the iterating step.
- We called the width_change function with appropriate arguments in the main function. We called the main function to run the program using the following lines of codes: if __name__ == ‘main‘: main()
[adinserter block=”3″]
Using The lw Attribute
We can also use the lw attribute, which is another name for linewidth. Its usage and functionality are the same as the linewidth attribute of matplotlib.
Example (2)
# Import all the required libraries and modules in the code
import matplotlib.pyplot as plt
import numpy as np
# Creating a user-defined function named lim_change


def width_change(x, y1, y2, y3, y4, y5,y6,y7):
    # Creating the figure object
    fig = plt.figure(figsize=(9, 9))
    # Plotting the figure
    plt.plot(x, y1, color='orange', lw=1)
    plt.plot(x, y2, color='blue', lw=2)
    plt.plot(x, y3, color='red', lw=3)
    plt.plot(x, y4, color='cyan', lw=4)
    plt.plot(x, y5, color='yellow', lw=5)
    plt.plot(x, y6, color='green', lw=6)
    plt.plot(x, y7, color='violet', lw=7)
    # Defining the title for the plot
    plt.title("Demonstrating how to change line width in matplotlib")
    # Defining the label along the x-axis
    plt.xlabel("x coordinates")
    # Defining the label along the y-axis
    plt.ylabel("y coordinates")
    # Displaying the plot
    plt.show()
# Creating the main() function


def main():
    # Creating the x coordinates of the data points
    x = np.arange(0, 10, 0.1)
    # Creating the y coordinates of the data points
    y1 = np.sin(x)*1
    y2 = np.sin(x)*2
    y3 = np.sin(x)*3
    y4 = np.sin(x)*4
    y5 = np.sin(x)*5
    y6 = np.sin(x)*6
    y7 = np.sin(x)*7
    # Calling the lim_change function
    width_change (x, y1, y2, y3, y4, y5,y6,y7)


# calling the main function
if __name__ == '__main__':
    main()
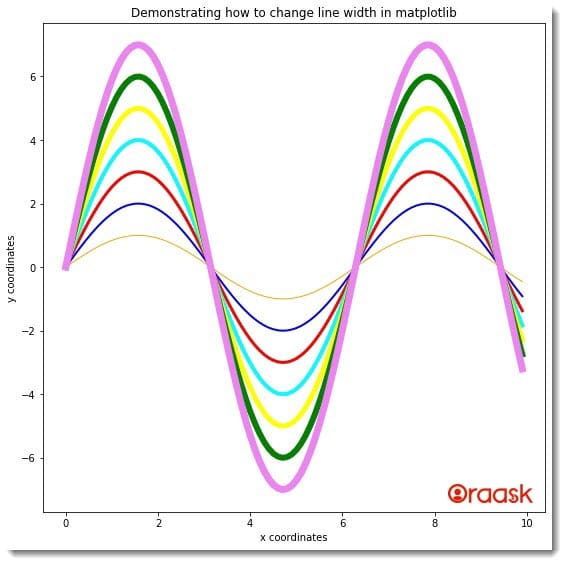
Output:

[adinserter block=”4″]
Changing The Line Width As Per The Values of Y
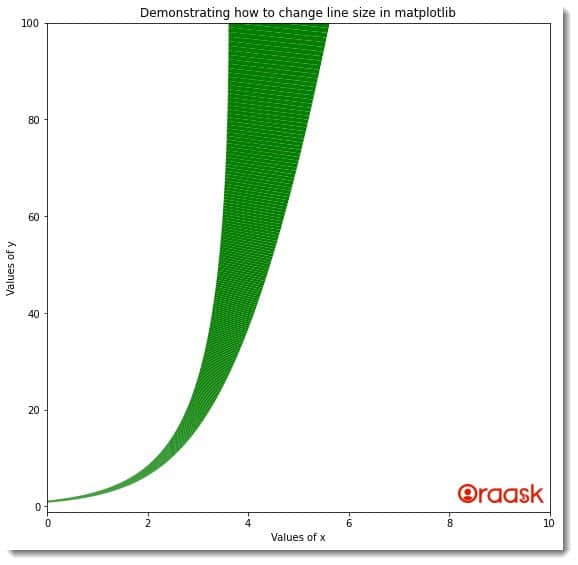
We can also change the line width as per the changing coordinates values. However, matplotlib does not have any in-built function to perform the same. We need to build our logic using different methods and techniques available in python along with the matplotlib attributes to achieve the same. We can change the line width based on the values of both the x and y coordinates. The below code illustrates the change in line width based on the value of y:
Example (3)
# Import all the required libraries and modules in the code
import matplotlib.pyplot as plt
import numpy as np
from matplotlib.collections import LineCollection
# Creating a user-defined  function named lim_change


def width_change(line):
    # Creating the figure object
    plt.figure(figsize=(9, 9))
    # Creating the axes object
    ax = plt.axes()
    # Creating a collection
    ax.add_collection(line)
    # Defining the limit along the x-axis
    ax.set_xlim(0, 10)
    # Defining the limits along the y axis
    ax.set_ylim(-1.1, 100)
    # Defining the title for the plot
    plt.title("Demonstrating how to change line size in matplotlib")
    # Defining the label along the x-axis
    plt.xlabel("Values of x")
    # Defining the label along the y-axis
    plt.ylabel("Values of y")
    # Displaying the plot
    plt.show()
# Creating the main() function


def main():
    # Defining the  x coordinates of the data points
    x = np.linspace(0, 10, 1000)
    # Defining the  y coordinates of the data points
    y = np.exp(x)
    # Defining the linewidth array
    line_widths = 1+np.array(y)
    # Transposing and changing the shape of the matrix
    points = np.array([x, y]).T.reshape(-1, 1, 2)
    # Pirinting the shape of the points variable
    print(f"The shape of the points array is: {points.shape}")
    print(f"The points array is: {points[:5]}")
    # Changing the shape of the matrix to the desired shape
    segments = np.concatenate([points[:-1], points[1:]], axis=1)
    # Pirinting the shape of the segments variable
    print(f"The shape of the segments array is: {segments.shape}")
    print(f"The segments array is: {segments[:5]}")
    line = LineCollection(segments, linewidths=line_widths, color='green')
    # Calling the lim_change function
    width_change(line)


# calling the main function
if __name__ == '__main__':
    main()
Output:
[adinserter block=”5″]
The shape of the points array is: (1000, 1, 2)
The points array is: [[[0. 1. ]]
[[0.01001001 1.01006028]]
[[0.02002002 1.02022176]]
[[0.03003003 1.03048548]]
[[0.04004004 1.04085245]]]
The shape of the segments array is: (999, 2, 2)
The segments array is: [[[0. 1. ]
[0.01001001 1.01006028]]
[[0.01001001 1.01006028]
[0.02002002 1.02022176]]
[[0.02002002 1.02022176]
[0.03003003 1.03048548]]
[[0.03003003 1.03048548]
[0.04004004 1.04085245]]
[[0.04004004 1.04085245]
[0.05005005 1.05132371]]]

Explanation:
- First, we imported the numpy and the matplotlib library in the code. Next, we defined a user-defined function named width_change. This is a void function, and it takes only one parameter, namely line.
- Under this function, we first created the figure object using the figure function. We also defined the axes object using the axes function of matplotlib. We set the attribute projection=” 3d” to obtain a three-dimensional plot in the figure space.
- Next, we used the add_collection function to create a collection of the data points.
- We set limits along the x and y axes using the set_xlim and set_ylim functions. We used the set_title function to define the title of the plot. Using the set_xlabel and the set_ylabel functions, we have defined the labels along the x and the y-axis, respectively.
- After the width_change function, we have defined the main function. This is the driving code of the program. We have created all the data points under this function. We used the LineCollection function to create a collection of the data points, which we used to change the line width dynamically in the program.
- Finally, we called the main function using the following lines of codes: if __name__ == ‘main‘: main()
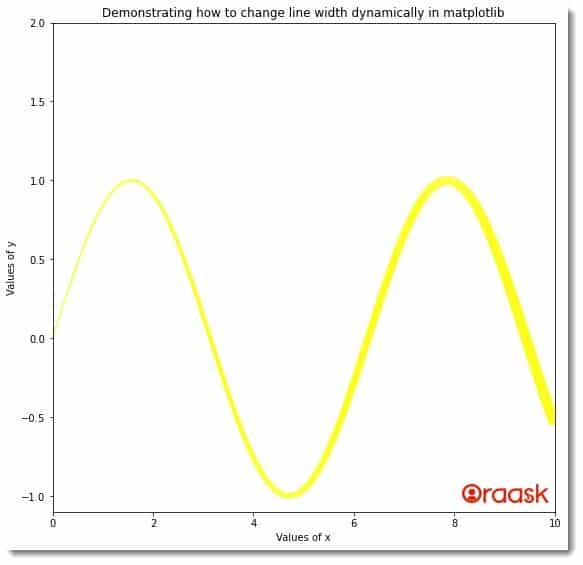
We can also change the line width as per the value of x. We only need to tweak a few places to achieve the same. The below code illustrates the change in line width based on the value of x:
Example (4)
# Import all the required libraries and modules in the code
import matplotlib.pyplot as plt
import numpy as np
from matplotlib.collections import LineCollection
# Creating a user-defined  function named lim_change


def size_change(line):
    # Creating the figure object
    plt.figure(figsize=(9, 9))
    # Creating the axes object
    ax = plt.axes()
    # Creating a collection
    ax.add_collection(line)
    # Defining the limit along the x-axis
    ax.set_xlim(0, 10)
    # Defining the limits along the y axis
    ax.set_ylim(-1.1, 2)
    # Defining the title for the plot
    plt.title("Demonstrating how to change line width dynamically in matplotlib")
    # Defining the label along the x-axis
    plt.xlabel("Values of x")
    # Defining the label along the y-axis
    plt.ylabel("Values of y")
    # Displaying the plot
    plt.show()
# Creating the main() function


def main():
    # Defining the  x coordinates of the data points
    x = np.linspace(0, 10, 1000)
    # Defining the  y coordinates of the data points
    y = np.sin(x)
    # Defining the linewidth array
    line_widths = 1+np.array(x)
    # Transposing and changing the shape of the matrix
    points = np.array([x, y]).T.reshape(-1, 1, 2)
    # Pirinting the shape of the points variable
    print(f"The shape of the points array is: {points.shape}")
    print(f"The points array is: {points[:5]}")
    # Changing the shape of the matrix to the desired shape
    segments = np.concatenate([points[:-1], points[1:]], axis=1)
    # Pirinting the shape of the segments variable
    print(f"The shape of the segments array is: {segments.shape}")
    print(f"The segments array is: {segments[:5]}")
    line = LineCollection(segments, linewidths=line_widths, color='yellow')
    # Calling the lim_change function
    size_change(line)


# calling the main function
if __name__ == '__main__':
    main()
[adinserter block=”6″]
Output:
The shape of the points array is: (1000, 1, 2)
The points array is: [[[0. 0. ]]
[[0.01001001 0.01000984]]
[[0.02002002 0.02001868]]
[[0.03003003 0.03002552]]
[[0.04004004 0.04002934]]]
The shape of the segments array is: (999, 2, 2)
The segments array is: [[[0. 0. ]
[0.01001001 0.01000984]]
[[0.01001001 0.01000984]
[0.02002002 0.02001868]]
[[0.02002002 0.02001868]
[0.03003003 0.03002552]]
[[0.03003003 0.03002552]
[0.04004004 0.04002934]]
[[0.04004004 0.04002934]
[0.05005005 0.05002916]]]

Changing The Line Width In Three DImensional plot
We can also change the line width using the linewidth function. The function behaves similarly to the three-dimensional plot, just like it does with two-dimensional plots. We can also use the lw attribute instead of the linewith the attribute. Both of them have similar effects.
Example (5)
[adinserter block=”7″]
# Import all the required libraries and modules in the code
import matplotlib.pyplot as plt
import numpy as np
# Creating a user-defined function named lim_change


def width_change(x, y1, y2, y3, y4, y5,y6,y7):
    # Creating the figure object
    fig = plt.figure(figsize=(9, 9))
    ax = plt.axes(projection ='3d')
    # Plotting the figure
    ax.plot3D(x, y1, color='orange', lw=1)
    ax.plot3D(x, y2, color='blue', lw=2)
    ax.plot3D(x, y3, color='red', lw=3)
    ax.plot3D(x, y4, color='cyan', lw=4)
    ax.plot3D(x, y5, color='yellow', lw=5)
    ax.plot3D(x, y6, color='green', lw=6)
    ax.plot3D(x, y7, color='violet', lw=7)
    # Defining the title for the plot
    ax.set_title("Demonstrating how to change line width in matplotlib")
    # Defining the label along the x-axis
    ax.set_xlabel("x coordinates")
    # Defining the label along the y-axis
    ax.set_ylabel("y coordinates")
    # Displaying the plot
    plt.show()
# Creating the main() function


def main():
    # Creating the x coordinates of the data points
    x = np.arange(0, 10, 0.1)
    # Creating the y coordinates of the data points
    y1 = np.sin(x)*1
    y2 = np.sin(x)*2
    y3 = np.sin(x)*3
    y4 = np.sin(x)*4
    y5 = np.sin(x)*5
    y6 = np.sin(x)*6
    y7 = np.sin(x)*7
    # Calling the lim_change function
    width_change (x, y1, y2, y3, y4, y5,y6,y7)


# calling the main function
if __name__ == '__main__':
    main()
Output:

[adinserter block=”8″]
Conclusion
In this article, we have learned how to change the line width statically and dynamically. We have used the linewidth attribute for the same.
We strongly recommend that readers practice all these discussed concepts to understand the topic more. We also encourage the readers to look up the python matplotlib documentation to better understand the topic.


