How Can We Help?
Python is one of the most widely used languages all over the world. And it’s an open-source language as well as free; it is categorized under the FOSS (Free and Open-Source Software). Over the years, it has got packages that are incredibly powerful for a lot of programming tasks. The matplotlib is the python library used to plot graphs and create animations.
Matplotlib offers a lot of visualizations. One such visualization is the histogram. In this article, we will learn how to change the bin size of histogram in Python matplotlib.
Note: For more information about Histogram in the Matplotlib library, follow this tutorial: Python Matplotlib Histogram
What are Histogram and bin Sizes?
A histogram is a graphical representation consisting of rectangular figures called bins representing continuous data.
Bins are usually rectangular shaped, and the length of the bins determines the relative values. This is very similar to the bar graph. The only difference is that the histogram represents continuous data.
Example
import matplotlib.pyplot as plt
import numpy as np
def histogram(x,y):
    plt.hist(x, bins=y)
    plt.show()
def main():
    x = np.array([45,44,245,425,174,545,486,235,377])
    y = np.array([100,200,300,400,500,600])
    histogram(x,y)
if __name__ == "__main__":
    main()
Output
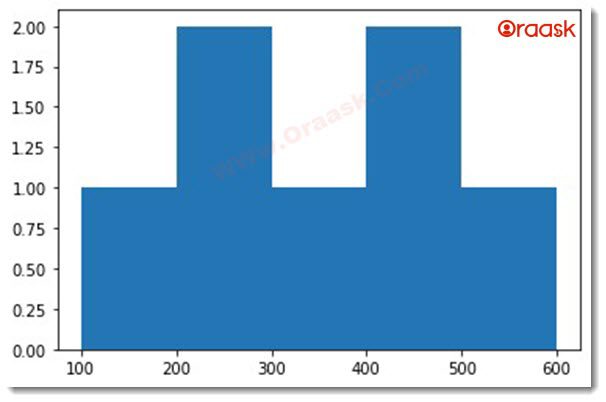
Explanation:
We can explain the above code as follows:
1. We first imported the required libraries and modules using the import statement. We have imported them using their alias names for convenience.
2. Then, we created a function called a histogram. It takes two arguments called x; the x value takes the values along the x-axis along the histogram, and the y takes the value along the y axis.
3. We used the hist () function to plot the histogram.
4. Next, we created the primary function, the central part of the python program.
5. We used the numpy library to specify the value of x and y. We used the arrange () function to make the data points as array objects.
6. We then called the histogram function to print the histogram.
7. Finally, we called the primary function using the following statement:
If __name__==”__main__”:
    main ()
What is the bin Size in Matplotlib Histogram?
The bin size is the width of the bins in matplotlib. This can be the same for all the bins and different for all bins. The length of the bins determines the range of values along the x-axis. So, it has physical significance too.
The matplotlib hist () function has an inbuilt attribute called the bins which can accept the values for the width of the bins.
How is bins Width Calculated in Matplotlib Histogram?
The calculation of the bin width is straightforward. It is simply the width difference between the range’s max and the minimum value. Suppose the class is 40-55. Then the bin width is (55-40)=15.
Create bins of equal sizes
Creating bins of equal size can be done in many ways.
Specify the Number of bins:
We can specify the number of bins to the plot() function. This will make the required number of bins all with equal width. Hence if the total size of the x-axis value is 100 and we specify 10 bins, then the size of each bin will be 100/10=10 units each.
Example
import matplotlib.pyplot as plt
import numpy as np
import random
def histogram(x,y):
    plt.hist(x, bins=10,color="purple")
    plt.title("Histogram")
    plt.xlabel("x values")
    plt.ylabel("y values")
    plt.show()
def main():
    x=[]
    for i in range(10):
        x.append(random.randint(200,1000))
    y = np.arange(1,100,10)
    histogram(x,y)
if __name__ == "__main__":
    main()
Output
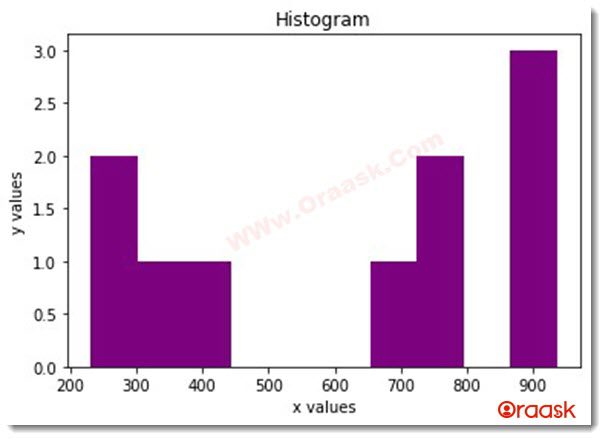
Specifying the bin Boundaries:
Matplotlib also offers the choice to choose the boundaries of the histogram bins. We can pass the parameter in the form of a list, where each element determines the boundaries of the bins in the plot.
Example
import matplotlib.pyplot as plt
import numpy as np
import random
def histogram(x,y):
    plt.hist(x, bins=y,color="yellow")
    plt.title("Histogram")
    plt.xlabel("x values")
    plt.ylabel("y values")
    plt.show()
def main():
    x=[]
    for i in range(10):
        x.append(random.randint(100,1000))
    print(x)
    y = np.arange(10,1000,100)
    print(y)
    histogram(x,y)
if __name__ == "__main__":
    main()
Output
[779, 561, 254, 787, 124, 274, 329, 774, 429, 442] [ 10 110 210 310 410 510 610 710 810 910]
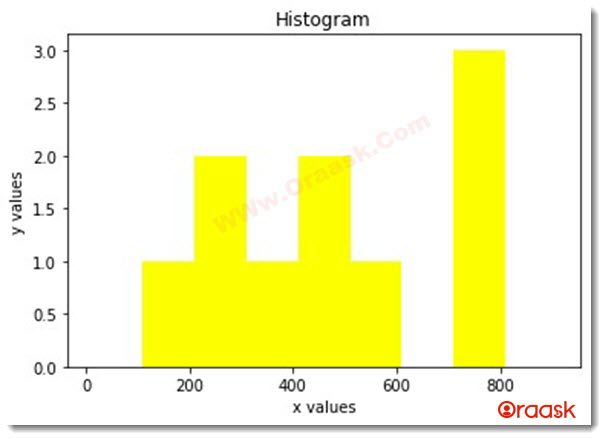
Explanation:
To explain the example above, look for the following points:
1. We first import the required libraries, namely matplotlib, numpy, and the random with alias names.
2. We then created a function called histogram () which takes two parameters, namely x and y.
3. We used the hist () function to plot the histogram. We passed the parameter x and the value of y to the bins argument and used the color parameter set to yellow.
4. We then specified the title and labels to the plot using the title(), xlabel(), and ylabel() functions.
5. We created another function called main. Under this function, we created an empty list called x. We introduced a loop that runs ten times. We used the random library to append a random number between 100 and 1000 during each iteration.
6. We printed the value of x. We then created the variable called y and appended the values using the arrange () function.
7. We then printed the value of y, called the function histogram (), and passed the x and y as arguments.
8. Finally, we called the main function, which is the main part of the code, using the following syntax:
if __name__ == "__main__":
    main ()
Specifying the Binding Width Through Algorithm
- First, find the array’s maximum and minimum numbers to find the graph’s lower and upper limits.
- Now, add the desired width to the numpy array to get equal width for each bin.
The syntax will be:
np.arange(start,start+width,width)Example
import matplotlib.pyplot as plt
import numpy as np
import random
def histogram(x,y):
    plt.hist(x, bins=y,color="blue")
    plt.title("Histogram")
    plt.xlabel("x values")
    plt.ylabel("y values")
    plt.show()
def main():
    x=[]
    for i in range(10):
        x.append(random.randint(100,1000))
    print(x)
    y = np.arange(min(x),max(x)+177,177)
    print(y)
    histogram(x,y)
if __name__ == "__main__":
    main()
Output
[229, 307, 636, 775, 462, 392, 480, 196, 901, 528]
[196 373 550 727 904]
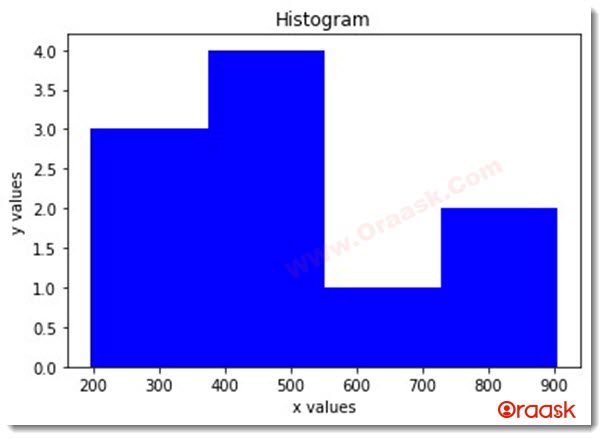
Create bins of Unequal Sizes
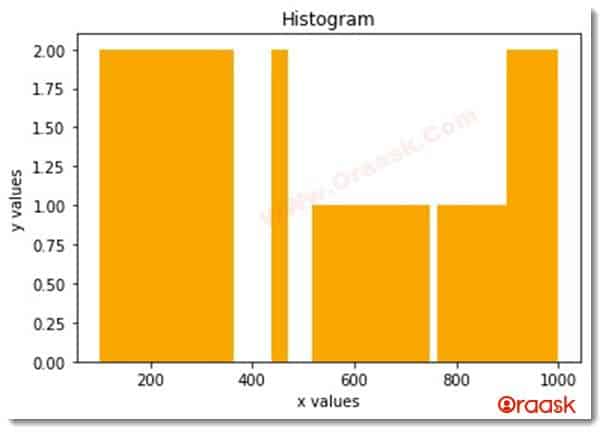
We can similarly create the bins of unequal width in matplotlib.
Create Unequal bins by Specifying the bin Width
We can specify unequal bin width to the bins. We can pass a list or array-like objects to the bin’s argument.
Example
import matplotlib.pyplot as plt
import numpy as np
import random
def histogram(x,y):
    plt.hist(x, bins=y,color="orange")
    plt.title("Histogram")
    plt.xlabel("x values")
    plt.ylabel("y values")
    plt.show()
def main():
    x=[]
    for i in range(10):
        x.append(random.randint(100,1000))
    print(x)
    y = []
    for i in range(10):
        a=random.randint(i,i+1)
        b=random.randint(i+1,i+2)
        y.append(random.randint(100*a,100*b))
    y.sort()
    print(y)
    histogram(x,y)
if __name__ == "__main__":
    main()
Output:
[228, 302, 138, 979, 122, 981, 713, 456, 803, 453]
[100, 203, 363, 439, 469, 518, 747, 762, 900, 1000]
Conclusion:
In this article, we have learned how to change the bins in the histogram. Sometimes the classes in the histogram are not equal, so the programmers need to use the functionalities to change the bin width manually to get the desired result. Yet sometimes, the programmers need to specify the same width but manually. In such a situation, the programmers need to use these concepts.
Readers are encouraged to go through the Python matplotlib documentation for further readings of the topic.


