How Can We Help?
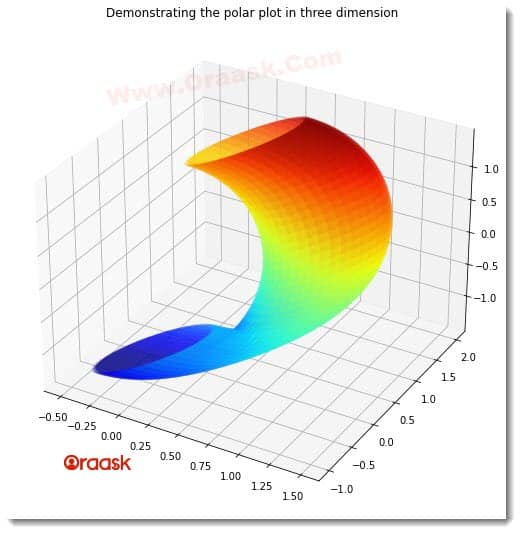
Matplotlib allows us to plot in both two and three dimensions. It also allows us to plot the figures in different types of plots, like rectangular coordinate systems. This article will explain how to plot polar plots in three dimensions.
The polar plot is extensively used in mathematics, physics, electrical engineering, etc.
Prerequisite:
Before proceeding with the codes, we strongly recommend that the users know the three-dimensional polar plot. The theory associated with the same is vast and beyond this article’s scope. We recommend that readers first go through the following links and understand the three-dimensional polar coordinate system.
- https://en.wikipedia.org/wiki/Cylindrical_coordinate_system
- https://en.wikipedia.org/wiki/Spherical_coordinate_system
You must also install the matplotlib and numpy library on the local working machine.
For the same open PowerShell if you are in windows or bash terminal if you are in macOS:
pip install numpy matplotlibDraw A 3D Polar Plot In Matplotlib
Assuming you have gone through the articles, we are now in a position to code and display a three-dimensional polar plot. We need to define the values like theta, radius, phi, etc., to plot the polar plot in three dimensions.
Example (1)
# Import the libraries and packages in the code
import numpy as np
import matplotlib.pyplot as plt
# Create a user-defined function named three_dimensional_polar()
def three_dimensional_polar(phi, theta):
# Definning the data points to be fitted into the polar plot
THETA, PHI = np.meshgrid(theta, phi)
# Defining the radius of the points
radius = np.cos(PHI)
# Defining the x coordinates of the points
x = radius * np.sin(PHI) + np.sin(THETA)
# Defining the y coordinates of the points
y = radius * np.cos(PHI) + np.cos(THETA)
# Defining the z coordinates of the points
z = radius * np.sin(PHI) + np.cos(THETA)
# Defining the figure object
fig = plt.figure(figsize=(9, 9))
# Defining the axes object
ax = fig.add_subplot(1, 1, 1, projection='3d')
# Plotting the figure
plot = ax.plot_surface(x, y, z, cmap=plt.get_cmap(
'jet'), linewidth=0, antialiased=True, alpha=0.3)
# Defining the title of the plot
plt.title("Demonstrating the polar plot in three dimension")
# Displaying the plot
plt.show()
# Creating the main() function
def main():
# Defining the angle in radian
theta = np.linspace(0, 5*np.pi, 40)
# Defining the angle in radian
phi = np.linspace(0, np.pi, 40)
# Calling the three_dimensional_polar() function
three_dimensional_polar(theta, phi)
# Calling the main() function
if __name__ == "__main__":
main()
Output:

Explanation:
- We first imported the libraries in the code using the import statement of python. We could also import the libraries anywhere in the code, but it is a good practice to import them at the top of the code.
- Next we created a user-defined function named three_dimensional_plot(). This is a void function; hence this does not return any value. The function takes two parameters, namely theta and phi. Under the function, we first created the mesh grid out of the two values from theta and phi using the meshgrid() function of matplotlib. We passed the values of theta and phi to the function as the arguments. This is a significant step to fit the data to plot the data points as a polar plot.
- Next, we created the data points for the x, y, and y-axis from the values of phi and theta using the numpy library of python. We then created the figure object using the figure() function. We specified the size of the figure using the figsize attribute. Next, we created the axes object using the add_subplot() function. We passed the argument named projection=” 3d” to specify that we wanted a three-dimensional plot.
- Next we plotted the graph using the ax.plot_surface() function. We first passed the values of x,y, and z as the arguments. We specified the color with the cmap attribute. We also specified the linewidth with the linewidth attribute. We set antialiased to True. If set to false, the figure won’t be smooth. We also specified the intensity of the color using the alpha attribute.
- Using the title() function, we specified the function’s title. We displayed the plot using the title() function.
- Next, we created the main() function. Under this function, we defined the data points for the theta and phi. We did this using the numpy library functions. We called the three_dimensional_plot() function to plot the graph.
- We finally declared the main() function as the main driving code of the program using the following lines of codes:
if __name__ == “__main__”:
main()
Check This: There is a full guide on Matplotlib Polar Plot if you want to know more about polar plots in Matplotlib library.
Conclusion:
In this article, we have discussed how to plot polar coordinates in three dimensions. We used the plot_surface() function to plot the same. We use such plots in the field of mathematics, engineering, etc.
We strongly recommend that users look up the python matplotlib documentation to understand the topic more.


