How Can We Help?
By default, the polar plot makes the plot with anticlockwise angles. However, the user may sometimes need to draw the plots clockwise instead of anticlockwise direction. This article will explain how to draw a polar clockwise plot in matplotlib.
Using The ax.set_theta_direction() Function
We can use the set_theta_direction function to define the plot along the clockwise direction. We only need to pass one more parameter to this function, i.e., -1.
Example (1)
# Importing all the necessary libraries and packages in the code
import numpy as np
import matplotlib.pyplot as plt
# Defining a user-defined function named polar_plot


def polar_plot(r, theta):
    # Creating a figure object
    plt.figure(figsize=(9, 9))
    # Dedining the subplots and axes object
    ax = plt.subplot(111, projection='polar')
    # Plotting the graph
    ax.plot(theta, r)
    # Defining the maximum value of the radius
    ax.set_rmax(5)
    ax.margins(y=0)
    ax.set_rticks([float(x) for x in range(0,5)])
    ax.set_rlabel_position(120)
    # Enbling grid in the plot
    ax.grid(True)
    tick = [ax.get_rmax(), ax.get_rmax()*0.97]
    for t in np.deg2rad(np.arange(0, 360, 5)):
        ax.plot([t, t], tick, lw=0.72, color="orange")
    ax.set_xlabel('Label using set_xlabel function', rotation=45, size=11)
    # Defining the title of the plot
    ax.set_title("A line plot on a polar axis with anticlockwise direction", va='bottom')
    # Displaying the plot
    plt.show()
# Defining the main function


def main():
    # Creating the data points for the polar plot
    r = np.arange(0, 4, 0.01)
    theta = 2 * np.pi * r
    polar_plot(r, theta)


# Calling the main function
if __name__ == "__main__":
    main()
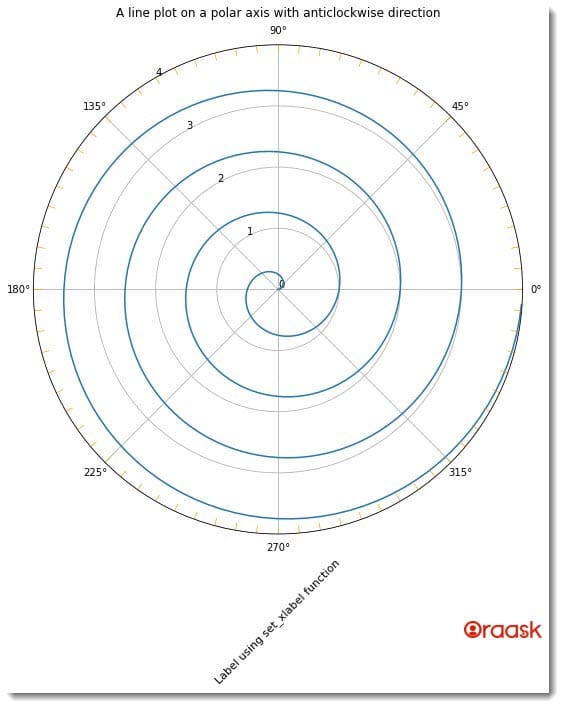
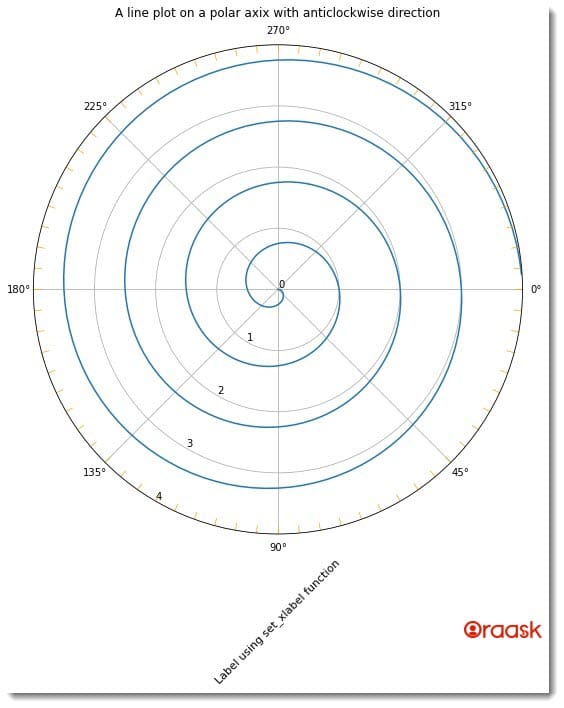
In the above code, we can observe that the plot is along the anticlockwise direction. We can use the ax.set_theta_direction() function and pass the function’s parameter as -1. This will ensure that the plot is now along the clockwise direction.
Check This: There is a full guide on Matplotlib Polar Plot if you want to know more about Polar plot (What it is and a lot more examples of it).
Example (2)
# Importing all the necessary libraries and packages in the code
import numpy as np
import matplotlib.pyplot as plt
# Defining a user-defined function named polar_plot


def polar_plot(r, theta):
    # Creating a figure object
    plt.figure(figsize=(9, 9))
    # Dedining the subplots and axes object
    ax = plt.subplot(111, projection='polar')
    ax.set_theta_direction(-1)
    # Plotting the graph
    ax.plot(theta, r)
    # Defining the maximum value of the radius
    ax.set_rmax(5)
    ax.margins(y=0)
    ax.set_rticks([float(x) for x in range(0,5)])
    ax.set_rlabel_position(120)
    # Enbling grid in the plot
    ax.grid(True)
    tick = [ax.get_rmax(), ax.get_rmax()*0.97]
    for t in np.deg2rad(np.arange(0, 360, 5)):
        ax.plot([t, t], tick, lw=0.72, color="orange")
    ax.set_xlabel('Label using set_xlabel function', rotation=45, size=11)
    # Defining the title of the plot
    ax.set_title("A line plot on a polar axis with anticlockwise direction", va='bottom')
    # Displaying the plot
    plt.show()
# Defining the main function


def main():
    # Creating the data points for the polar plot
    r = np.arange(0, 4, 0.01)
    theta = 2 * np.pi * r
    polar_plot(r, theta)


# Calling the main function
if __name__ == "__main__":
    main()
Explanation:
- First, we imported all the necessary libraries and packages in our code using the import statement of python. We have imported the numpy library and the pyplot module in our code. We also used the alias names of the libraries and modules for more convenience in writing our program.
- Next, we created a user-defined function named polar_plot. This function is a void function that takes two parameters, namely, r and theta. Under this function, at first, we used the figure function to define the figure size of the plot. We used the subplot function to define the axes of the plot. We specified the parameter projection=”polar” to define that we need to plot a polar plot. Next, we did the most critical part of our program. We used the set_theta_direction function to make the clockwise plot. Next, we used the plot function to plot the polar plot.
- We set the radius of the plot using the set_rmax function. We also set the margin of the plot to 0px using the function of the margin. Next, we have created the major polar tricks to visualize the figure better using the set_rticks function. We used the set_xlabel function to define the label of the plot and the set_title function to define the plot’s title. Under this function at the final step, we used the show function to display the plot. Note that using the show function is optional in Jupyter Notebook.
- Next, we created the main function. The main function is the driving code of our program. Under this function, we have created all the data points we need to plot the figure. We used the arange function to create the data points. The arange function takes three parameters: start, stop, and step. The start defies the number with which we should start the iteration, the stop defines the number to which we need to make the iteration, and the step defines the iterating step. We generated data points consisting of the distance of each point from the center and its corresponding angle value. We called the polar_plot function to display the plot.
- Finally, we called the main function using the following lines of codes: if __name__ == “main“: main()
Conclusion
In this article, we learned how to plot the polar plot clockwise. We saw the usage of the plt.theta_direction() for the same. Along with it, we also learned a few other associated functions and their attributes. We recommend that the readers use the function to try plotting clockwise polar plots on their own to understand the topic better.


