How Can We Help?
In every plot, a few hyperparameters are present so we can visualize the plot better. They are not necessary, yet essential to visualize the plot better. The ticks are one such example of hyperparameters in the polar plot. This article will explain how to draw polar ticks in python matplotlib.
Prerequisite:
Before proceeding with the codes, please make sure you have a good understanding of the different properties of the polar plot.
We need to install a few libraries for the programs to run. They are matplotlib and numpy
We can install them through the PowerShell of Windows, the bash shell of Linux, or the mac operating system.
Just type the following commands:
pip install matplotlib
pip install numpy
[adinserter block=”1″]
Using The set_rticks Function
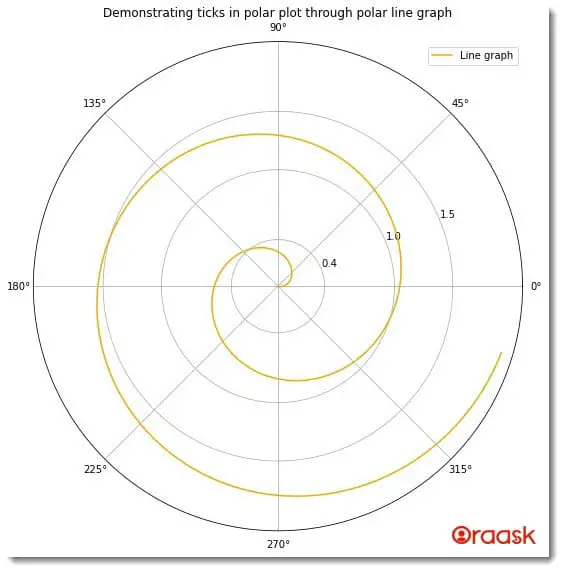
The function we can use to set the ticks in matplotlib is the set_rticks function. The function accepts a list or array-like objects as the parameters. The elements of the array should be of float data type.
Example (1)
# import all the necessary modules and libraries in the code
import numpy as np
import matplotlib.pyplot as plt
import math
# creating a user-defined function called polar


def polar(radius, radians):
    # Defining the figure size of the plot
    plt.figure(figsize=(9, 9))
    # creating a polar object
    ax = plt.axes(projection='polar')
    # Defining the ticks
    ax.set_rticks([0.4, 1, 1.5])
    # iterating each angle in radians
    ax.plot(radians, radius, color="orange")
    # creating a title for the graph
    ax.set_title("Demonstrating ticks in polar plot through polar line graph")
    # creating a legend for the graph
    ax.legend(["Line graph"])
    # displaying the graph
    plt.show()
# creating the main() function


def main():
    radius = np.arange(0, 2, 0.001)
    # creating data points for the angles of each point
    radians = 2 * np.pi * radius+6
    # calling the polar function
    polar(radius, radians)


# calling the main() function
if __name__ == '__main__':
    main()
Output:
[adinserter block=”2″]

Explanation:
- First, we imported all the necessary libraries and packages in the code using the import statement of python. We used the technique of aliasing for convenience in our code.
- Next, we have created a user-defined function named polar. This is a void function, and it takes two arguments, namely radius, and radians. Under this function, we first defined the size of the plot using the figsize attribute of the figure function. Next, we have defined the axes through the axes function. We passed the argument projection=”3d” to the function to plot the polar plot. We used the set_ticks function to set the ticks on the plot. Next, we used the plot function to plot the graph. We have also passed the color attribute to this function to define the color of the plot.
- Now we have used the set_title function to define the function’s title. We also defined legend to the pot using the legend function of matplotlib.
- Next, we used the show function to display the plot. Note that this is optional to use the show function with the Jupyer Notebook.
- After the polar function, we created the main function. This is the driving code of our program. Under this function, we have defined all the data points. We used the arange function of the numpy library to define the data points. The arange function takes three arguments, namely start-stop and step. The start defines the number with which the iteration should start. The stop defines the number of the iteration that should run, and the step defines the iterating step.
- Finally, we called the main function with the help of the following lines of codes: if __name__ == ‘main‘: main()
[adinserter block=”3″]
Check This: There is a full guide on Matplotlib Polar Plot if you want to know more about Polar plot like (What it is and a lot more examples of it).
Creating Minor Ticks
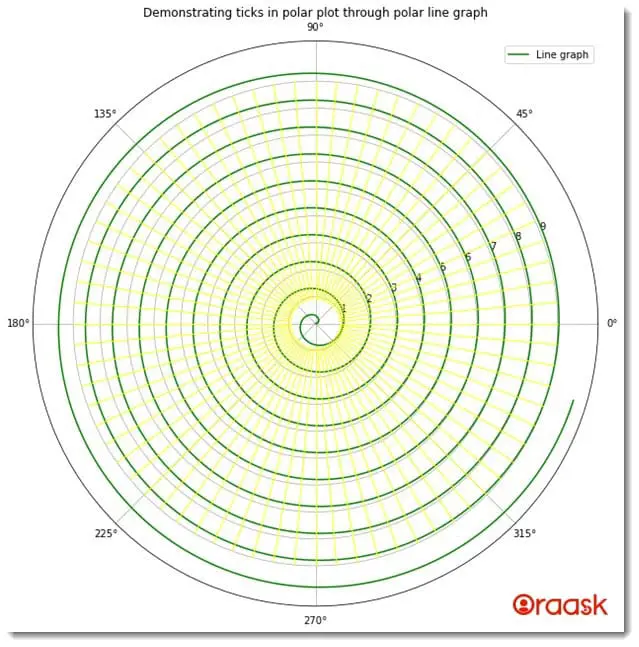
Matplotlib also allows us to create minor ticks. We can use the ticks argument of the plot function for the same.
Example (2)
# import all the necessary modules and libraries in the code
import numpy as np
import matplotlib.pyplot as plt
import math
# creating a user-defined function called polar


def polar(radius, radians):
    # Defining the figure size of the plot
    plt.figure(figsize=(9, 9))
    # creating a polar object
    ax = plt.axes(projection='polar')
    # Defining the ticks
    ax.set_rticks([int(x) for x in range(1,10)])
    # Defining the minor ticks
    tick = [ax.get_rmax(), ax.get_rmax() * 0.1]
    # iterating each angle in radians
    ax.plot(radians, radius, color="green")
    for t in np.deg2rad(np.arange(0, 360, 5)):
        ax.plot([t, t], tick, lw=1, color="yellow")
    # creating a title for the graph
    ax.set_title("Demonstrating ticks in polar plot through polar line graph")
    # creating a legend for the graph
    ax.legend(["Line graph"])
    # displaying the graph
    plt.show()
# creating the main() function


def main():
    radius = np.arange(0, 10, 0.001)
    # creating data points for the angles of each point
    radians = 2 * np.pi * radius+6
    # calling the polar function
    polar(radius, radians)


# calling the main() function
if __name__ == '__main__':
    main()
[adinserter block=”4″]
Output:

Explanation:
- We imported the numpy math library in our code along with the pyplot module. Next, we have created a user-defined function, namely polar. Under this function, we have used the figure function to create the figure object. We used the figsize attribute of the function to define the size of the plot.
- Next, we created the axes object using the axes function. We passed the parameter, namely projection=” polar,” to specify that the plot needs to be polar.
- Next, we used the list comprehension technique to define the data points for the major ticks. We used the get_rmax() function to define the minor ticks and store the value in the variable ticks as elements of the list.
- Next, we used the plot function to plot the polar plot. We passed the necessary parameters to this function, like radians and radius, along with the color. Next, we iterated from 0 to 360 with iterating step of 5. Under each iteration, we have plotted the minor ticks. We used the plot function for the same.
- Next, we have defined the plot’s title using the set_title function. We also defined legend to the plot using the legend function.
- After the polar function, we created the main function. This is the driving code of the program. Under the main function, we have created the radius and the radians variable to define the poor plot.
- We called the polar function with appropriate arguments to plot the graph.
- Next, we called the main function with the help of the following code: if __name__ == ‘main‘: main()
[adinserter block=”5″]
Conclusion
In this article, we have learned how to create polar ticks in matplotlib. We have seen the usage of the set_rticks function for the same. We also saw the usage of other libraries and functions along with it.
We strongly recommend that readers practice all the discussed concepts to understand the topic more.


