How Can We Help?
Creating a watermark is one of the most critical aspects for any textual or visual content creator. To a large extent, this reduces the risk of plagiarism for some time and lets others know some specific message shared by the creator. This message can be anything from the creator’s name to the creation date.
This article will explain how to add a watermark to the matplotlib.
Prerequisite
We will use a couple of libraries and packages in this article. Make sure you have matplotlib,numpy, and OpenCV installed on your machine.
[adinserter block=”1″]
If you haven’t installed them yet, then open your terminal and run the following commands:
pip install matplotlib numpy opencv-pythonUsing The Text Function
The most common method to add a watermark to the plot is to use the text function. This is an in-built function of the pyplot module. The function takes several arguments, but only one of them is mandatory. This mandatory argument is the text that needs to be displayed in the plot as the watermark.
Below are some of the most widely used parameters of the function:
- x: This attribute takes the x coordinate of the plot where we need to place the center of the watermark. It assumes a floating value.
- y: This attribute takes the y coordinate of the plot where we need to place the center of the watermark
- text arguments: We need to pass the text which needs to be displayed as the watermark.
- font-size: This attribute takes floating values. This value defines the text size we shall display in the plot.
- color: This attribute, as the name suggests, defines the name of the color of the watermark.
- ha: This attribute defines the horizontal alignment of the watermark in the plot.
- va: This attribute defines the vertical alignment of the watermark. Again this is optional to use, and by default, it assumes the value “center”.
- rotation: This attribute defines the rotation of the watermark concerning the x-axis. It is often a standard practice to place the watermark in a tilted fashion rather than placing it horizontally. The value should be given in the form of a degree from 0 to 360. However, if we pass a value more than 360, then python will assume the value of n%360.
[adinserter block=”2″]
Example (1)
# Import all the necessary libraries and packages in the code
import matplotlib.pyplot as plt
import numpy as np
# Define the scatter_plot function


def watermark(n, y, z):
    # Define the size of the scatter plot
    plt.figure(figsize=(9, 9))
    # Creating the axes object
    ax = plt.axes()
    # Plotting the scatter plot
    ax.plot(y, z)
    # Defining the watermark
    ax.text(0.5, 0.5, 'Created by Oraask community', transform=ax.transAxes,
            fontsize=50.1, color='yellow', alpha=0.5,
            ha='center', va='center', rotation=45)
    # Iterating through the n variable and creating the annotation
    for i, txt in enumerate(n):
        ax.annotate(txt, (y[i], z[i]))

    # Defining the label along the x-axis
    plt.xlabel("X coordinates")
    # Defining the label along the y-axis
    plt.ylabel("Y coordinates")
    # Defining the title of the plot
    plt.title("Demonstrating the watermark in matplotlib")
    # Displaying the plot
    plt.show()
# Defining the main function


def main():
    # Creating the data points
    y = np.arange(1, 10, 1)
    z = np.power(y, 2)
    # Making pairs from the elements from y and z.
    n = zip(y, z)
    # Calling the scatter_plot function
    watermark(n, y, z)


# Calling the main function
if __name__ == "__main__":
    main()
Output:

[adinserter block=”3″]
Explanation:
- First, we imported all the necessary libraries and packages into our code using the import statement of python.
- Next, we have created a user-defined function named watermark. This is a void function, and it only plots a figure. It takes three arguments, namely n,y, and z.
- Next, under this plot, we have created the figure size using the figsize attribute of the figure function. Next, we created the axes object using the axes function of the pyplot module. We plotted the graph using the plot function.
- Next, we used the text function of the axes object. This function is used to add the watermark to the plot. We passed several arguments to this function. Using the associated attributes, we specified the plot’s font size, color, intensity, etc..
- Next, we created an enumerated form of the variable n and iterated through it. Under each iteration, we have added annotation to the plot. Next, we defined the labels along the x and the y axes using the xlabel and the ylabel functions. We also used the show function to display the graph. Note that it is optional to use the show function with Jupyter Notebook.
- After the watermark function, we created the main function. This is the driving code of the program. Under this function, we have created all the data points. We created a zip out of the y and the z variables and stored it in another variable named n. We passed the arguments to the watermark function to plot the graph.
- Finally, we called the main function using the following lines of codes: if __name__ == “main“: main()
Creating Watermark In Three Dimensional Plot
Matplotlib also allows us to add watermarks in three-dimensional plots. The three-dimensional plots are equally important; just like the two-dimensional plot, they must be protected using the watermark. We can use the same text function to add a watermark to the plot. All the attributes we mentioned earlier are also valid in the three-dimensional plot.
[adinserter block=”4″]
Example (2)
# import all the necessary libraries and packages in our code
import matplotlib.pyplot as plt
import numpy as np
# Creating a user-defined function change_color


def watermark(z, x, y):
    # Creating the figure object
    plt.figure(figsize=(9, 9))
    # Creating the axes object
    ax = plt.axes(projection='3d')
    # Adding a watermark to the plot
    ax.text(3.5, 5, 5, 'Created by Oraask', transform=ax.transAxes,
            fontsize=50, color='green', alpha=0.5,
            ha='center', va='center')
    # Plotting the figure
    ax.plot3D(x, y, z)
    # Setting title of the plot
    ax.set_title(
        'Demonstrating watermark with the three-dimensional plot')
    # Defining the x label
    ax.set_xlabel('x axis')
    # Defining the y label
    ax.set_ylabel('y axis')
    # Displaying the plot
    plt.show()
# Defining the main function


def main():
    z = np.linspace(0, 1, 100)
    x = np.linspace(0, 1, 100)
    y = np.linspace(0, 1, 100)
    # Calling the change_color function
    watermark(z, x, y)


# Calling the main function
if __name__ == "__main__":
    main()
Output:
[adinserter block=”5″]

Using Pictures as Watermark
Sometimes we may want to add images as the watermark instead of plain text. Suppose an organization created a graph from a survey. Then instead of putting plain text, they would prefer to add their logos to the plot as a watermark. Putting images as watermarks to the plot is really simple. We need to follow the following steps for the same:
- First, read the image using some image processing libraries of python like the image, OpenCV, etc.
- Next, plot the graph and create multiple subplots of the figure. Add the plot in one subplot and the image in another. Remember to reduce the intensity of the image color.
Ensure that you enter the correct path of the image file. Your path for the image file shall be different. Copy and paste the exact path into the imread function.
[adinserter block=”6″]
Example (3)
# Import all the necessary libraries and packages in the code
import matplotlib.pyplot as plt
import numpy as np
import matplotlib.cbook as cbook
import matplotlib.image as image
# Define the scatter_plot function


def watermark(im, x, y):
    # Creating the axes and the figure object
    fig, ax = plt.subplots(figsize=(9, 9))
    # Plotting the figure
    ax.plot(x, y)
    # Defining the grid
    ax.grid()
    # Defining the watermark
    fig.figimage(im, 10, 10, zorder=3, alpha=0.2)
    # Defining the label along the x-axis
    plt.xlabel("X coordinates")
    # Defining the label along the y-axis
    plt.ylabel("Y coordinates")
    # Defining the title of the plot
    plt.title("Demonstrating the watermark in matplotlib")
    # Displaying the plot
    plt.show()
# Defining the main function


def main():
    with cbook.get_sample_data('/media/asifr/New Volume/work/code/mac2.jpg') as file:
        im = image.imread(file)
    x = np.linspace(0, 1)
    # Creating the data points
    y = np.sin(10 * x)
    # Calling the scatter_plot function
    watermark(im, x, y)


# Calling the main function
if __name__ == "__main__":
    main()
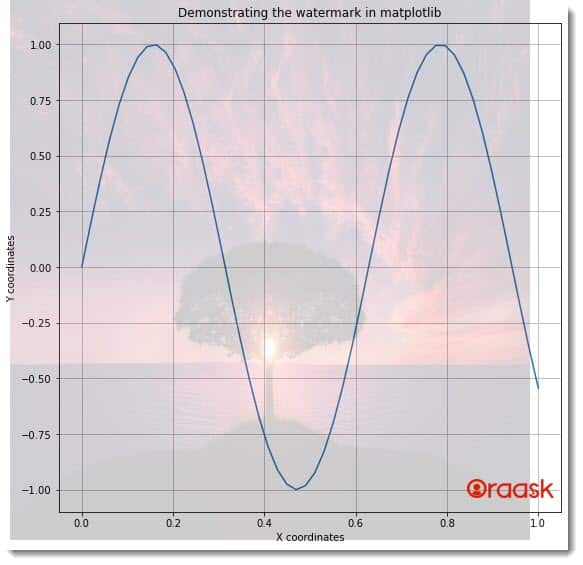
Output:

[adinserter block=”7″]
Explanation:
- First, we have imported all the necessary libraries and packages in our code using the import statement. We imported the matplotlib to plot our graph, the numpy library to create the datasets for our plot, the image module to read and preprocess the image, and the cbook to access directories and folders.
- Next, we created the watermark function. This user-defined function takes only three arguments, namely im,x, and y. Under this function, we first defined the axes, and the figures object using the subplot function of the matplotlib library.
- We plotted the graph using the plot function. We passed the parameter, namely x and y. Next, we have defined the grid of the figure. We used the figimage function to place the image as a background /watermark of the plot.
- Next, we defined the labels along the axes. We used the xlabel and ylabel functions for the same. We used the title function to set the title of the plot.
- After the watermark function, we created the main function. This is the driving code of our program.
- We used the cbook function to access the folder path. Next, we used the imread function of the image module to read the image. We also used the linspace function to create data points for the plot. The linspace function takes three arguments: start, end, and step. The start defines the starting number with which the iteration should start. The end defines the number up to which the iteration should run. The step defines the iterating step.
- Next, we called the watermark function to plot the graph. We called the main function with the help of the following lines of codes:
if __name__ == “main“:
main()
[adinserter block=”8″]
Adding Image As A Watermark In Three Dimensional Plot
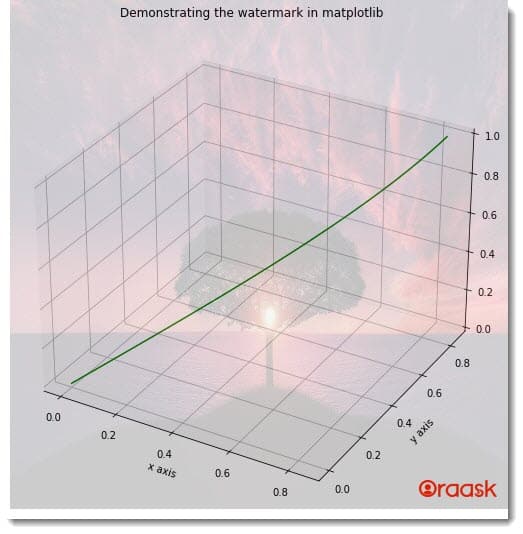
We can also add a watermark to the three-dimensional matplotlib plots. We can use the same technique in the previous example to add watermark images to the two-dimensional plot.
Example (4)
# import all the necessary libraries and packages in our code
import matplotlib.pyplot as plt
import numpy as np
import matplotlib.cbook as cbook
import matplotlib.image as image
# Creating a user-defined function change_color


def change_color(im,z,x, y):
    # Creating the figure object
    fig = plt.figure(figsize=(9, 9))
    # Creating the axes object
    ax = plt.axes(projection ='3d')
    fig.figimage(im, 10, 10, zorder=3, alpha=0.2)
    # Plotting the figure
    ax.plot3D(x,y, z, 'green')
    # Setting title of the plot
    ax.set_title('Demonstrating the watermark in matplotlib')
    # Defining the x label
    ax.set_xlabel('x axis')
    # Defining the y label
    ax.set_ylabel('y axis')
    # Displaying the plot
    plt.show()
# Defining the main function


def main():
    # Read the image
    with cbook.get_sample_data('/media/asifr/New Volume/work/code/mac2.jpg') as file:
        im = image.imread(file)
    # Creating the data set
    z = np.linspace(0, 1, 100)
    x = np.sin(z)
    y = np.sin(z)
    # Calling the change_color function
    change_color(im,z,x,y)


# Calling the main function
if __name__ == "__main__":
    main()
Output:

[adinserter block=”9″]
Conclusion
In this article, we have understood how to add a watermark in the matplotlib plots. We first saw using the text function to add a watermark to the plot. The text function can be used to add only a watermark which is in the form of text. We also saw how to add images as watermarks in the matplotlib plots.
We highly recommend that the readers practice all these concepts by changing the parameters and their values to understand how the parameters affect the results. We also recommend that the readers look up the python matplotlib documentation to understand the topic more.


