How Can We Help?
Annotations in any plot are a very informative part. We use the annotation to better understand the visualization by highlighting the crucial parts or points in the plot. They are also essential to pass any comment on the plot if needed. For example, suppose we plotted a coronavirus plot over recent years. Then we can use the annotate property to mark important events on the plot (for example, the discovery of a new vaccine, etc.). This article will explain how to use the annotation in matplotlib python.
[adinserter block=”1″]
Prerequisite:
Before we understand the codes associated with this topic, we should ensure we have a few libraries installed in our working machine. Otherwise, you will encounter errors while imprecation the code.
If you are a windows user:
- Open the PowerShell
- Type the following commands in the PowerShell (Hit enter after each line):
- Pip install matplotlib
- Pip install mpl_toolkits
- Pip install pylab
- Pip install import numpy
If you are a Linux or a macOS user, open the bash terminal and type the following. Hit enter after each line.
- Pip install matplotlib
- Pip install mpl_toolkits
- Pip install pylab
- Pip install import numpy
Demonstrating simple annotation in matplotlib:
We use the annotate() function to specify the annotation in python. There are a couple of arguments to design the text box and the arrow to be used depending on our preferences.
[adinserter block=”2″]
Example (1)
# Import all the libraries and packages in the code
import pylab
from mpl_toolkits.mplot3d import Axes3D
from mpl_toolkits.mplot3d import proj3d
import numpy as np
import matplotlib.pyplot as plt
# Creating a user-defined function named annotate()
def annotate(x, y, z, posx, posy, posz, text):
    # Creating the figure class
    fig = pylab.figure(figsize=(9, 9))
    # Creating a subplot for the plot
    ax = fig.add_subplot(111, projection='3d')
    # Plotting the figure
    sc = ax.scatter(x, y, z, color="red")
    # Unpacking the values
    x2, y2, _ = proj3d.proj_transform(posx, posy, posz, ax.get_proj())
    # Defining the annotate with all the necessary characteristics
    label = pylab.annotate(f"{text}", xy=(x2, y2), xytext=(-200, 200), textcoords='offset points', ha='left', bbox=dict(boxstyle='circle', fc='green', alpha=0.7),
                           arrowprops=dict(arrowstyle='->'))
    # Defining the title of the figure
    plt.title("Demonstrating annotation in python")
    # Displaying the plot
    pylab.show()
# Defining the main() function
def main():
    # Defining the value of the plot along the x-axis
    x = np.arange(0, 10, 1)
    # Defining the value of the plot along the y-axis
    y = np.arange(0, 10, 1)
    # Defining the value of the plot along the z-axis
    z = np.arange(0, 10, 1)
    # Defining the x coordinate of the arrow point
    posx = 1.25
    # Defining the y coordinate of the arrow point
    posy = 3.2
    # Defining the z coordinate of the arrow point
    posz = 1
    # Defining the text to be displayed in the plot
    text = "This is the third point"
    # Calling the annotate() function
    annotate(x, y, z, posx, posy, posz, text)
# Calling the main() function
if __name__ == "__main__":
    main()
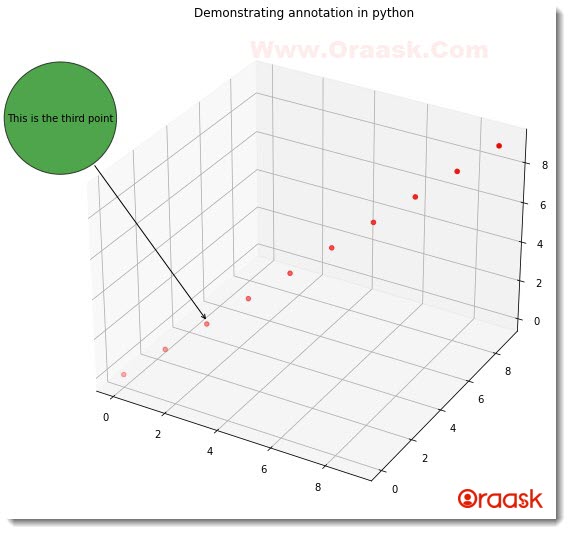
Output:

[adinserter block=”3″]
Explanation:
- First, we imported the required libraries and packages in our code using the import statement of python. Make sure that you have all the imported libraries installed on your machine. We imported the libraries using alias names for convenience in writing our codes.
- Next, we created a user-defined function named annotate (). Under this function, we first created the figure object. We specified the size of the figure using the figsize attribute of matplotlib. Now we created the axes object using the add_subplot() function. We specified the projection of the plot to be three dimensions. Next, we plotted the scatter plot. We passed the parameters to the function scatter (). We also used another parameter named color to specify the color of the plot. We specified red color in the plot.
- Next, we unpacked the values from the position for the labels using the following lines of codes:
- x2, y2, _ = proj3d.proj_transform (posx, posy, posz, ax.get_proj())
- The proj3d.proj_transform () function takes four positional arguments. The first three are the coordinates of the arrow pointer, and the last one is to obtain the axes object parameter for projection.
- Now comes the essential part of the code. We used the annotate () function to create the annotation in the plot. We specified all the plot characteristics using the attributes associated with the function. We used the string formatting to get the specified text displayed in the annotation bar. We specified the xytext attribute, which takes the float argument and is used to define the distance of the annotate from the point. The value depends on the values of x, y and z chosen. WE specified the box style using the bbox **kargument. We specified the style of the box to be circular using the circle attribute, we specified the color of the box to be green using the fc attribute, and the intensity of the box color using the alpha attribute.
- After the label, we defined the plot’s title using the plt.title() function. We displayed the plot using the plot.show() function. Note that it is optional to use in Jupyter Notebook.
- After the annotate () function, we defined the main () function, which is the main part of the code. We defined the values of x, y, and z using the numpy arrange() function. The function takes three positional arguments. The first argument defines the starting of the number for iteration to start. The second argument defines the last number up to which the iteration should run, and the last argument defines the iteration step.
- We defined the position of the annotation. Note that most of the time, we must try hit and trial to place the annotation at the best possible position. We also defined the text that must be displayed in the main () function itself. After all these, we called the annotate () function, which is the user-defined function here.
- Finally, we called the main () function using the following lines of codes:
if __name__ == “__main__”:
main ()
Check This: There is a full guide on Matplotlib 3D Bar Chart if you want to know more about 3D Charts.
[adinserter block=”4″]
Associated arguments of the annotate () attribute:
- The first argument we give is a string. It’s the most crucial argument because it defines the text that must be displayed in the annotation.
- xy: This argument takes tapeless data type, and its elements are of float data type. It defines the coordinates of the annotated. Only two elements are present in the tuple, which defines the x and y coordinates.
- xytext: This argument again takes tuples as the data types. The elements of the tuples can be of float type. It defines the distance of the annotated text from the point it points to.
- Width: This attribute takes a float as the argument. It’s an optional argument and defines the arrow’s width in the annotation.
- bb.set_boxstyle(): We use this function to define the style of the box only, including color, the opacity of the color, color, padding, etc. Under this function, we have many attributes. We use the color attribute is used to specify the color of the annotated box. We use the alpha attribute to specify the opacity of the color. It’s optional and takes float values between 0 and 1. 0 means no opacity, and 1 maximum means opacity. We can specify the box style type by passing the value as a string. We have the circle, Darrow, LArrow, RArrow, Round, Round4, Roundtooth, Sawtooth, and Square box types to choose from. We use the pad attribute to specify the padding of the box.
- arrowstyle: We use this attribute to specify the style of the arrow to be used. We have to provide the value within the string.
- Rotation: We use this attribute to define the rotation of the annotated box with the view angle. The rotation attribute takes the angle in the form of float data type. For example, if set to 90, the box will be in the vertical direction.
Let us now see one more example on the annotation to understand the topic better.
Check This: Article on How to Label Each Point in Scatter Plot Matplotlib if you want to know more about labeling points in a scatter plot with practical examples.
Example (2)
[adinserter block=”5″]
# Import all the libraries and packages in the code
import pylab
from mpl_toolkits.mplot3d import Axes3D
from mpl_toolkits.mplot3d import proj3d
import numpy as np
import matplotlib.pyplot as plt
# Creating a user-defined function named annotate()
def annotate(x, y, z, posx, posy, posz, text):
    # Creating the figure class
    fig = pylab.figure(figsize=(9, 9))
    # Creating a subplot for the plot
    ax = fig.add_subplot(111, projection='3d')
    # Plotting the figure
    sc = ax.scatter(x, y, z, color="purple")
    # Unpacking the values
    x2, y2,_ = proj3d.proj_transform(posx, posy, posz, ax.get_proj())
    # Defining the annotate with all the necessary characteristics
    label = pylab.annotate(f"{text}", xy=(x2, y2), xytext=(-50, 50),rotation=0,textcoords='offset points', ha='left',bbox=dict(boxstyle='square,pad=2', fc='orange', alpha=0.8),arrowprops=dict(arrowstyle='->'))
    # Defining the title of the figure
    plt.title("Demonstrating annotation in python")
    # Displaying the plot
    pylab.show()
# Defining the main() function
def main():
    # Defining the value of the plot along the x-axis
    x = np.arange(0, 100, 1)
    # Defining the value of the plot along the y-axis
    y = np.sin(x)
    # Defining the value of the plot along the z-axis
    z = np.cos(x)
    # Defining the x coordinate of the arrow point
    posx = 0.3
    # Defining the y coordinate of the arrow point
    posy = 0.9
    # Defining the z coordinate of the arrow point
    posz = 0.6
    # Defining the text to be displayed in the plot
    text = "This is a random point"
    # Calling the annotate() function
    annotate(x, y, z, posx, posy, posz, text)
# Calling the main() function
if __name__ == "__main__":
    main()
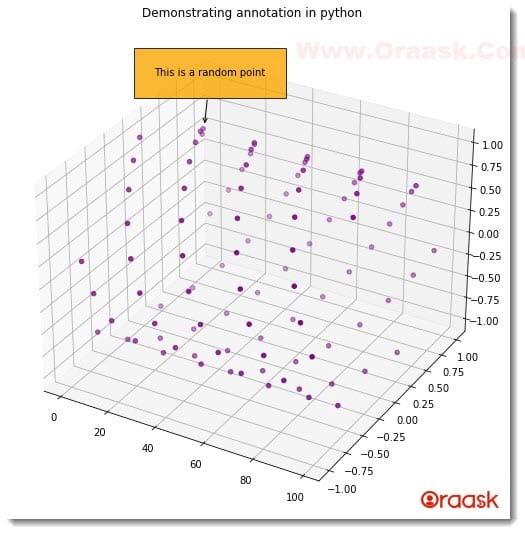
Output:

[adinserter block=”6″]
Conclusion:
This article taught us how to use the annotation in matplotlib plots. We used the annotate () function to create the annotation in the plot. We learned about the associated attributes and functions. We covered all the important points and concepts in this article. However, we strongly recommend the users go through the python matplotlib documentation to understand the topic more by exploring the associated functions and attributes.


