How Can We Help?
Line transparency is the intensity of the color of the lines in matplotlib. Matploltlib allows us to customize every minute detail of the plot. Luckily we can change the line transparency using the matplotlib too. We can both statically change the transparency of the color of the line plot as well as change the transparency dynamically. This article will explain how to change the line transparency using matplotlib.
Using the alpha attribute
The most popular method to change the transparency of the line color is to use the alpha attribute of the plot function. The attribute takes a float value between 0 and 1 (both inclusive. Python will throw errors if we try to give values outside this range.
Syntax:
alpha=<some floating point numer>Return value:
Null, It only changes the transparency of the color
[adinserter block=”1″]
Example (1)
# import all the necessary libraries and modules in the code
import matplotlib.pyplot as plt
import random
import math
# defining the main() function


def transparency_change(x, y):
    # defining the size of the plot
    plt.figure(figsize=(9, 9))
    # plotting the values manually in the code.
    plt.plot(x, y, color='blue', alpha=0.2)
    # defining the label along the x-axis
    plt.xlabel("Values of x")
    # defining the label along the y-axis
    plt.ylabel("Values of y")
    # defining the title of the plot
    plt.title("Demonstrating the transparency change of line color in matplotlib")
    # displaying the plot
    plt.show()


def main():
    random.seed(42)
    # defining the x values
    x = [int(i)
         for i in range(150)]
    # defining the y values
    y = [(3+x*random.randint(-2, 2)*math.exp(-1*random.randint(-4, 4)))
         for x in range(0, 150)]
    transparency_change(x, y)


# calling the main() function
if __name__ == "__main__":
    main()
Output:
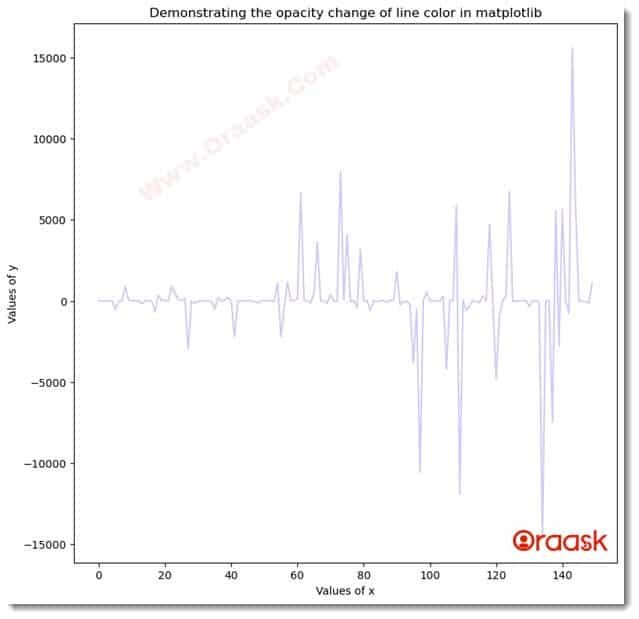
Explanation:
- First, we imported all the necessary libraries and modules in our code using the import statement of python. We imported the pyplot module, random library, and math library in the code.
- Next, we created a user-defined function named transparency_change, which is a void function. It takes two arguments, called x and y. Under this function, we created the figure object using the figure function of the pyplot module.
- Next, we plotted the graph using the plot function and passed the parameter x and y to the function. We mentioned the color of the plot to be blue, and we changed the transparency of the color using the alpha attribute of matplotlib.
- Next, we used the xlabel and the ylabel function to change the labels of the plot.
- We used the title function of matplotlib to change the plot’s title. Next, we used the show function to display the plot. Note that this is, however, optional to use the show function in Jupyter Notebook.
- Now we created the main function, which is the driving code of the program. Under this function, we first used random.seed() function. This is a python method to get similar random numbers each time we run the code if we use the random function.
- We created the coordinates of the data points using the list comprehension technique. Finally, we called the main function using the following lines of code:: if __name__ == “main“: main()
[adinserter block=”2″]
Customizing the color transparency as per x and y values
Matplotlib does not allow us to automatically set the color transparency as per the values along the x and y axes. However, we can implement our logic to change the color transparency as per the values along the x and y axes. We can utilize different functionalities of the functions of python as well as its libraries to achieve the same.
Changing line transparency color as per values along the x-axis
We can change the line transparency as per the values along the x-axis by adopting the following method:
- Define all the data points in the plot.
- Next, do not plot the entire plot. Instead, iterate through the arrays and plot only one line between two successive points in each iteration.
- Now adjust the corresponding value of the alpha depending on its value. Note that you can customize the type of function and values you may adopt here. An illustration of this method will make this method clear to you.
[adinserter block=”3″]
Example (2)
# import all the necessary libraries and modules in the code
import matplotlib.pyplot as plt
import random
import math
import numpy as np
# defining the main() function


def transparency_change(x, y):
    # defining the size of the plot
    plt.figure(figsize=(9, 9))
    # plotting the values manually in the code.
    for i in range(1, 100):
        # Iterating through the code and plotting lines only between successive points.
        plt.plot(x[i:i+2], y[i:i+2], color='orange', alpha=i*0.01)
    # defining the label along the x-axis
    plt.xlabel("Values of x")
    # defining the label along the y-axis
    plt.ylabel("Values of y")
    # defining the title of the plot
    plt.title("Demonstrating the transparency change of line color in matplotlib")
    # displaying the plot
    plt.show()


def main():
    # defining the x values
    x = np.arange(0, 100, 0.1)
    # defining the y values
    y = np.sin(x)
    transparency_change(x, y)


# calling the main() function
if __name__ == "__main__":
    main()
Output:
[adinserter block=”4″]
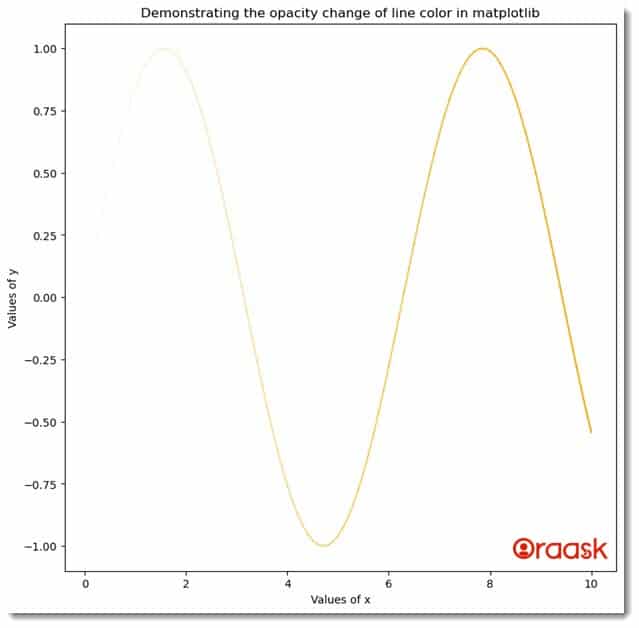
Explanation:
- First, we imported all the necessary libraries and packages in the code using the import statement of python. We imported the pyplot, random, and the math module of python.
- Next, we created the transparency_change function in the code. This is a user-defined function and is a void function. Under this function, we first defined the size of the plot using the figsize attribute of the figure function of the pyplot module.
- Next, we iterated from 1 to 100, and under each iteration, we took two successive points and plotted a line between them. We defined the transparency of the line depending on the value of i in each iteration.
- After the iteration, we defined the labels using the xlabel and the ylabel functions of the pyplot module.
- Next, we used the title function to define the title of the figure. We also used the show function to display the figure. Note that this is, however, optional to use the function in Jupyter notebook.
- After the transparency_change function, we created the main function, which is the driving code of the program. Under this function, we have defined all the coordinate values for the data points.
- We called the transparency_change function to plot the figure. Finally, we called the main function using the following lines of codes: if __name__ == “main“: main()
In the above code, we have increased the transparency with increasing values of x. Suppose you want to decrease the transparency with increasing values of x. In that case, you only need to subtract the current value from 1, or you can adopt any other method such that the alpha value will decrease with an increasing value of x.
Example (3)
# import all the necessary libraries and modules in the code
import matplotlib.pyplot as plt
import random
import math
import numpy as np
# defining the main() function


def transparency_change(x, y):
    # defining the size of the plot
    plt.figure(figsize=(9, 9))
    # plotting the values manually in the code.
    for i in range(1, 100):
        plt.plot(x[i:i+2], y[i:i+2], color='brown', alpha=1-i*0.01)
    # defining the label along the x-axis
    plt.xlabel("Values of x")
    # defining the label along the y-axis
    plt.ylabel("Values of y")
    # defining the title of the plot
    plt.title("Demonstrating the transparency change of line color in matplotlib")
    # displaying the plot
    plt.show()


def main():
    random.seed(42)
    # defining the x values
    x = np.arange(0, 100, 0.1)
    # defining the y values
    y = np.cos(x)
    transparency_change(x, y)


# calling the main() function
if __name__ == "__main__":
    main()
[adinserter block=”5″]
Output:
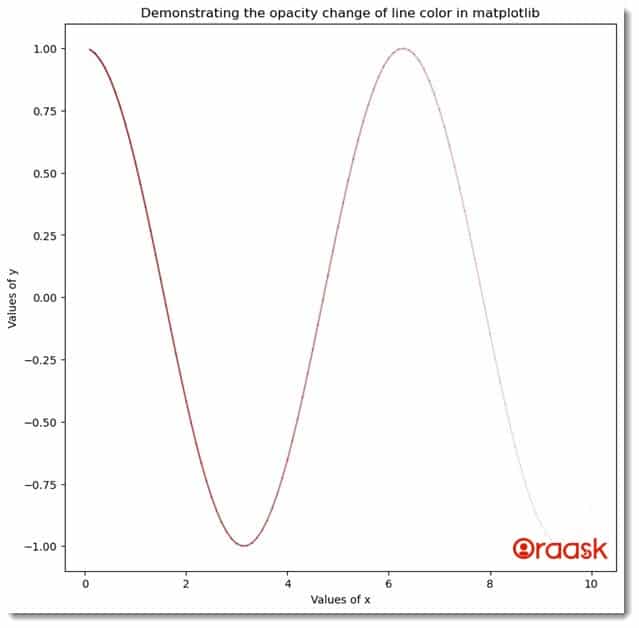
Changing the transparency as per the values along the y axis
We can also change the transparency of the line plot as per the values along the y-axis. Perhaps this is more important to understand because it is more practical.
We can again adopt the following method to achieve the same:
- First, define all the data points for the plot, i.e., the values along the x and the y axis.
- Next, define a method to standardize the data points between 0 and 1. And we can change the values of alpha as per the method.
Example (4)
# import all the necessary libraries and modules in the code
import matplotlib.pyplot as plt
import random
import numpy as np
# defining the main() function


def transparency_change(x, y):
    # defining the size of the plot
    plt.figure(figsize=(9, 9))
    # plotting the values manually in the code.
    minimum_y = min(y)
    maximum_y = max(y)

    for i in range(1, 100):
        plt.plot(x[i:i+2], y[i:i+2], color='blue', alpha=1 -
                 float((maximum_y-y[i:i+1])/maximum_y-minimum_y))
    # defining the label along the x-axis
    plt.xlabel("Values of x")
    # defining the label along the y-axis
    plt.ylabel("Values of y")
    # defining the title of the plot
    plt.title("Demonstrating the transparency change of line color in matplotlib")
    # displfaying the plot
    plt.show()


def main():
    random.seed(42)
    # defining the x values
    x = np.linspace(0, 100, 100)
    # defining the y values
    y = x
    transparency_change(x, y)


# calling the main() function
if __name__ == "__main__":
    main()
Output:
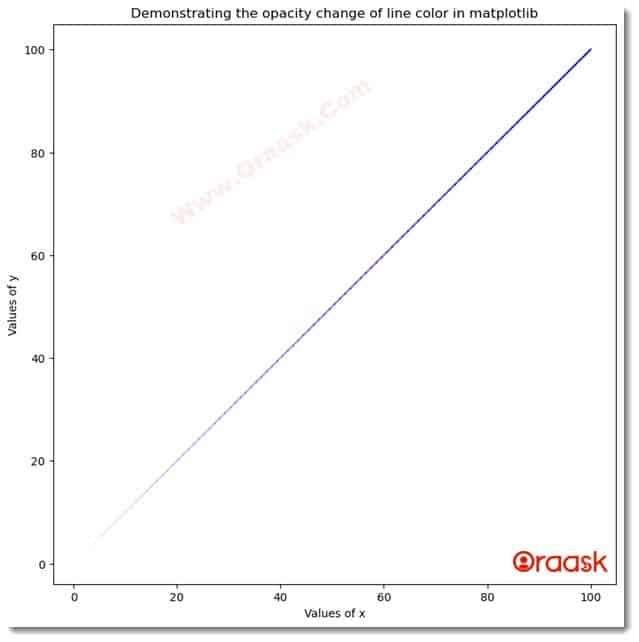
In the above code, we have increased the value of alpha by increasing the value of y, but we can also decrease the value of alpha by increasing the value of y.
[adinserter block=”6″]
Example (5)
# import all the necessary libraries and modules in the code
import matplotlib.pyplot as plt
import numpy as np
import random
# defining the main() function


def transparency_change(x, y):
    # defining the size of the plot
    plt.figure(figsize=(9, 9))
    # plotting the values manually in the code.
    minimum_y = min(y)
    maximum_y = max(y)
    for i in range(1, 99):
        plt.plot(x[i:i+2], y[i:i+2], color='green',
                 alpha=float((maximum_y-y[i:i+1])/maximum_y-minimum_y))
    # defining the label along the x-axis
    plt.xlabel("Values of x")
    # defining the label along the y-axis
    plt.ylabel("Values of y")
    # defining the title of the plot
    plt.title("Demonstrating the transparency change of line color in matplotlib")
    # displaying the plot
    plt.show()


def main():
    random.seed(42)
    # defining the x values
    x = np.linspace(0, 100, 100)
    # defining the y values
    y = np.power(x, 2)
    transparency_change(x, y)


# calling the main() function
if __name__ == "__main__":
    main()
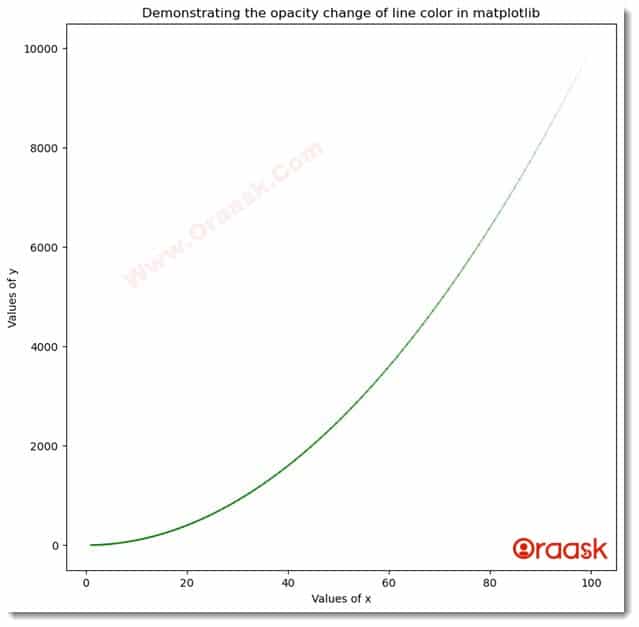
Output:
Explanation:
[adinserter block=”7″]
In the above code, we have tweaked only a few lines to change the transparency of the line color along the y-axis. We have first stored the maximum and the minimum value of the y. We iterated from 1 to 99, and with each iteration, we plotted a line between two successive points. We have defined a method to normalize the values between 0 and 1 to fit into a valid alpha value such that the alpha value increases with the increasing value of y. We used the following method to normalize the values between 0 and 1:
(maximum_y-y[i:i+1])/maximum_y-minimum_y
However, you can choose any other method depending on your requirements.
Conclusion
In this article, we have understood how to change the line transparency in Matplotlib. We have discussed the alpha attribute’s most popular technique to change the line color’s transparency. Wel first discussed how to change the transparency of the whole line plot. Later we also discussed how to change the transparency of the line plot with the changing values of x and y. These methods are indirect; hence, readers can choose and define their logic in the codes. Matplotlib, by default, does not provide any attribute to change the transparency dynamically.
[adinserter block=”8″]


