How Can We Help?
Introduction
Programmers sometimes may need to change the background color of the figure in matplotlib. This may be because they need to make the future more colorful or because they want to ensure the background color suits well with the color of the plot. Matplotlib allows changing of the color as well as the opacity of the background color.
In this article, we will understand how to change the background color of the figure in matplotlib.
Using The set_facecolor Function
The most widely used function to change the plot’s background color is the set_facecolor function. The function takes one argument, namely the color. We can specify the color with the name of the color, color code, HTML color code, RGB color code, etc.
Example (1)
# Import all the necessary modules and libraries
import matplotlib.pyplot as plt
import numpy as np
# Create the function for plotting the axes class


def change_background(x, y1, y2):
    fig = plt.figure(figsize=(9, 9))
    # Creating the axes
    ax = plt.axes()
    # Plotting the first plot
    ax1 = ax.plot(x, y1)
    # Plotting the second plot
    ax2 = ax.plot(x, y2)
    # Adding the labels
    ax.legend(labels=("sin(x)", "cos(x)"))
    # Setting the face color to  grey
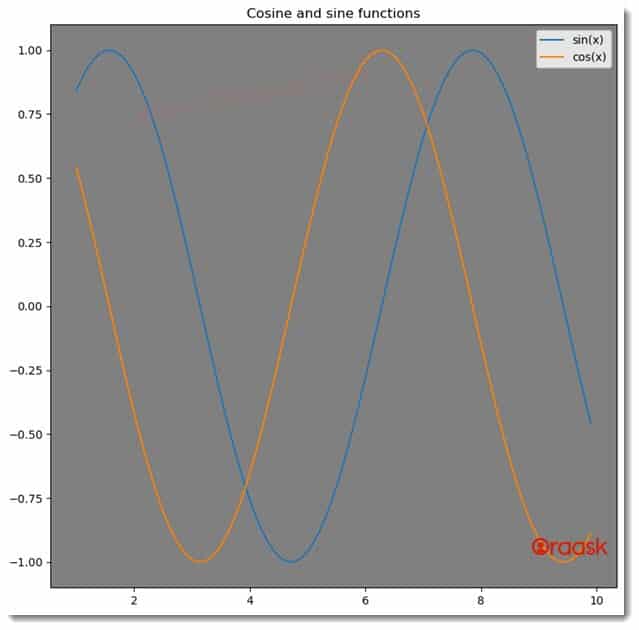
    ax.set_facecolor("grey")
    # Defining the title of the plot
    ax.set_title("Cosine and sine functions")
# Creating the main function


def main():
    # Creating the values of the x coordinates for the data points
    x = np.arange(1, 10, 0.1)
    # Creating the values of the y coordinates for the data points of the first plot
    y1 = np.sin(x)
    # Creating the values of the y coordinates for the data points of the second plot
    y2 = np.cos(x)
    # Calling the change_background function
    change_background(x, y1, y2)


# calling the main function
if __name__ == "__main__":
    main()
Output:

Explanation:
- First, we imported all the necessary libraries and packages in our code using the import statement of python. We used their aliasing names for convenience in writing our codes further.
- Next, we created a user-defined function named change_color. The function takes two arguments, namely x, y1 and y2. This is also a void function since this does not return anything.
- Under the function, we first created the figure object using the figure function of matplotlib. Next, we created the axes object using the axes function of matplotlib. We used the plot function to plot the figure. We called the plot function twice to plot two different figures. We used the legend function to set the legend to the plot.
- Next, we used the set_facecolor function to set the background color of the figure. We set the background color of the figure to grey. We used the set_title function to set the title of the figure.
- After the change_background function, we created the main function. This is the driving code of the program. Under this function, we created the x and y coordinates of the data points. We called the change_background function to plot the figure.
- Finally, we called the main function using the following lines of codes:
if __name__ == “main“:
main()
Check This: There is a full guide on Matplotlib Colors if you want to know more about colors in matplotlib.
Setting Color To The Outer Region Of The Plot
Matplotlib also allows us to change the color of the outer region of the plot. We can achieve the same with the help of the figure function of matplotlib. We only need to pass the face color attribute to the function and set our desired color. The color will be set to the outer portion of the plot.
Example (2)
# Import all the necessary modules and libraries
import matplotlib.pyplot as plt
import numpy as np
# Create the function for plotting the axes class


def change_background(x, y1, y2):
    fig = plt.figure(figsize=(9, 9), facecolor="orange")
    # Creating the axes
    ax = plt.axes()
    # Plotting the first plot
    ax1 = ax.plot(x, y1, color="green")
    # Plotting the second plot
    ax2 = ax.plot(x, y2, color="blue")
    # Adding the labels
    ax.legend(labels=("sin(x)", "cos(x)"))
    # Setting the face color to  grey
    ax.set_facecolor("yellow")
    # Defining the title of the plot
    ax.set_title("Cosine and sine functions")
# Creating the main function


def main():
    # Creating the values of the x coordinates for the data points
    x = np.arange(1, 10, 0.1)
    # Creating the values of the y coordinates for the data points of the first plot
    y1 = np.power(x, 2)
    # Creating the values of the y coordinates for the data points of the second plot
    y2 = np.power(x, 3)
    # Calling the change_background function
    change_background(x, y1, y2)


# calling the main function
if __name__ == "__main__":
    main()
Output:

Explanation:
- As customary, we first imported all the necessary functions and libraries in our code using the import statement.
- Next, we created a user-defined function named change_background. Under this function, we created the figure object using the figure function of python. We set the size of the figure using the figsize attribute. We also passed the attribute face color to the function to set the color on the outer surface of the plot region.
- Next, we created the axes object using the axes function of matplotlib. We plotted the figures using the plot function of the axes object. Next, we added legends to the figure using the legend function. We set the background color to the plot using the set_facecolor function. We also set the title of the plot using the set_title function.
- Next, we created the main function. This is the driving code of our program. We created the values of the coordinates of the data points using the numpy libraries. We used the arange function to generate the numpy array. The arange function takes three arguments, called start, stop and step. The start defines the number with which the iteration should start; the stop defines the number up to which the iteration should run, and the step defines the iterating steps. We called the change_background function to plot the figure.
- Finally, we called the main function using the following lines of codes: if __name__ == “main“: main()
We also have an alternative to the above approach. Instead of using the attribute of face color for the outer region of the plot, we can use the following lines of codes:
fig.patch.set_facecolor(‘green’)
Check This: Article on How to Change Line Style in Matplotlib if you want to know how to give different styles to a line plot with practical examples.
Example (3)
# Import all the necessary modules and libraries
import matplotlib.pyplot as plt
import numpy as np
# Create the function for plotting the axes class


def change_background(x, y1, y2):
    fig = plt.figure(figsize=(9, 9))
    # Creating the axes
    ax = plt.axes()
    # Plotting the first plot
    ax1 = ax.plot(x, y1)
    # Plotting the second plot
    ax2 = ax.plot(x, y2)
    # Adding the labels
    ax.legend(labels=("sin(x)", "cos(x)"))
    # Setting the face color to  green
    fig.patch.set_facecolor('green')
    # Defining the title of the plot
    ax.set_title("Cosine and sine functions")
# Creating the main function


def main():
    # Creating the values of the x coordinates for the data points
    x = np.arange(1, 5, 0.1)
    # Creating the values of the y coordinates for the data points of the first plot
    y1 = np.tan(x)
    # Creating the values of the y coordinates for the data points of the second plot
    y2 = np.exp(x)
    # Calling the change_background function
    change_background(x, y1, y2)


# calling the main function
if __name__ == "__main__":
    main()
Output:

Using the rcParams method:
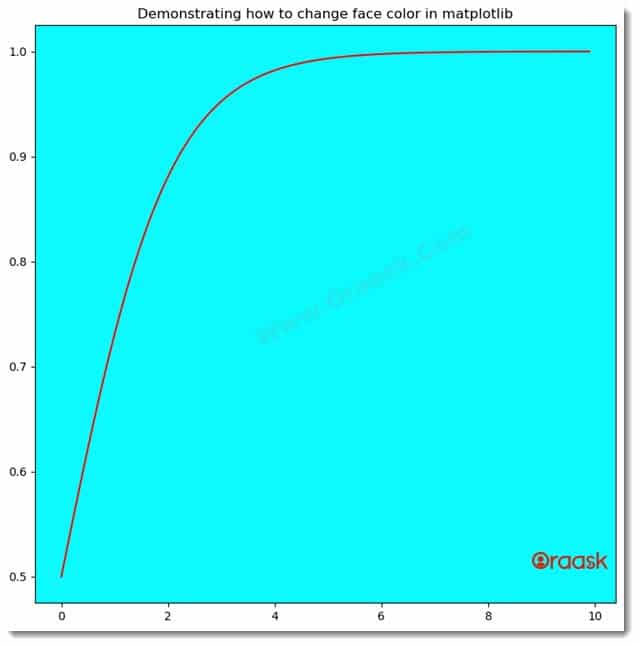
We can also use the rcParams method to change the background color of matplotlib in python. We need to use the following syntax for the same:
rcParams[‘axes.facecolor’] =\
Example (4)
# Import all the required libraries and modules in the code
import matplotlib.pyplot as plt
import numpy as np
# Creating a user-defined  function named lim_change


def change_background(x, y):
    # Creating the figure object
    fig = plt.figure(figsize=(9, 9))
    # Plotting the figure
    plt.plot(x, y, color='red')
    # Defining the face color of the figure
    plt.rcParams['axes.facecolor'] = 'cyan'
    # Defining the title for the plot
    plt.title("Demonstrating how to change face color in matplotlib")
    # Displaying the plot
    plt.show()
# Creating the main() function


def main():
    # Creating the x coordinates of the data points
    x = np.arange(0, 10, 0.1)
    # Creating the y coordinates of the data points
    y = 1/(1+np.exp(-x))
    # Calling the lim_change function
    change_background(x, y)


# calling the main function
if __name__ == '__main__':
    main()
Output:

We can also change the color outside the plot area using this method. We need to use the following syntax for the same:
Example (5)
# Import all the required libraries and modules in the code
import matplotlib.pyplot as plt
import numpy as np
# Creating a user-defined  function named lim_change


def change_background(x, y):
    # Creating the figure object
    fig = plt.figure(figsize=(9, 9))
    # Plotting the figure
    plt.plot(x, y, color='green')
    # Defining the face color of the figure
    plt.rcParams['figure.facecolor'] = 'orange'
    # Defining the title for the plot
    plt.title("Demonstrating how to change face color in matplotlib")
    # Displaying the plot
    plt.show()
# Creating the main() function


def main():
    # Creating the x coordinates of the data points
    x = np.arange(0, 5, 0.1)
    # Creating the y coordinates of the data points
    y = np.sin(x**2)+np.cos(x**2)
    # Calling the lim_change function
    change_background(x, y)


# calling the main function
if __name__ == '__main__':
    main()
Output:

Explanation:
- We imported the matplotlib.pyplot module and the numpy library using the import statement of python.
- Next, we created a user-defined function named chang_background. This is a void function and takes two parameters called x and y. Under this function, we first created the figure object using the figure function of python matplotlib. Next, we plotted the figure using the plot function. We set the color of the plot to green using the color attribute.
- Now we used the rcParams to change the face color of the figure. We set the color to orange. Next, we defined the title of the figure using the title function. We used the show function to display the figure. However, in Jupyter notebook, this is optional to use the show function.
- Next, we created the main function, which is the driving code of the program. Under this function, we created the coordinates of the data points. We called the chang_background function with appropriate arguments.
- Finally, we declared the main function as our driving code with the help of the following lines of codes: if __name__ == ‘main‘: main()
Conclusion:
This article taught us how to change the background color of matplotlib plots. We used the set_facecolor function to change the background color. We also used a few other methods, like the rcParams method, to change the matplotlib background.
Although we have discussed the most crucial aspect of the topic, we strongly recommend the readers go through the python matplotlib documentation to understand the topic more.


