How Can We Help?
How to Hide Axis Text in Matplotlib Plots
Matplotlib allows various tasks to be performed on the plots so that we can customize the plots. We can hide the axis texts from our plot using many available functions of python matplotlib. We may need to use such a feature when we do not need the values along the axes; instead, we are only interested in the visualization of the plot. This article will explain how to hide the axis text in matplotlib.
Using the xticks() and yticks() Functions
Using the xticks() and yticks(), we can remove the texts along the axis of the plot. All we need to do is that we need to call the function and pass no argument to this function except an empty list or list-like object.
Example (1)
# Import all the libraries and packages in the code
import matplotlib.pyplot as plt
import numpy as np
# Create a user-defined function named plot_fig
def plot_fig(x, y1, y2, y3):
    # Creating the figure object
    fig = plt.figure(figsize=(9, 9))
    # Plotting the first line
    plt.plot(x, y1, 'g', linewidth=2)
    # Plotting the second line
    plt.plot(x, y2, 'r', linewidth=2)
    # Plotting the third line
    plt.plot(x, y3, 'b', linewidth=2)
    # Defining the title of the plot
    plt.title('Disabling xticks and yticks', fontsize=20)
    # Defining label along the x-axis
    plt.xlabel('X axis', fontsize=15)
    # Defining label along the y-axis
    plt.ylabel('Y axis', fontsize=15)
    # Removing all the texts along the axis
    plt.xticks([])
    plt.yticks([])
    # Displaying the function
    plt.show()
# Creating the main() function
def main():
    # Creating data points for the x-axis
    x = np.arange(1, 100, 1)
    # Creating data points for the y axis
    y1 = np.power(x, 2)+np.power(x, 1)+155
    y2 = np.power(x, 2)+np.power(x, 1)+2257
    y3 = np.power(x, 2)+np.power(x, 1)+3755
    # Calling the plot_fig() function
    plot_fig(x, y1, y2, y3)
# Calling the main() function
if __name__ == "__main__":
    main()
Output:
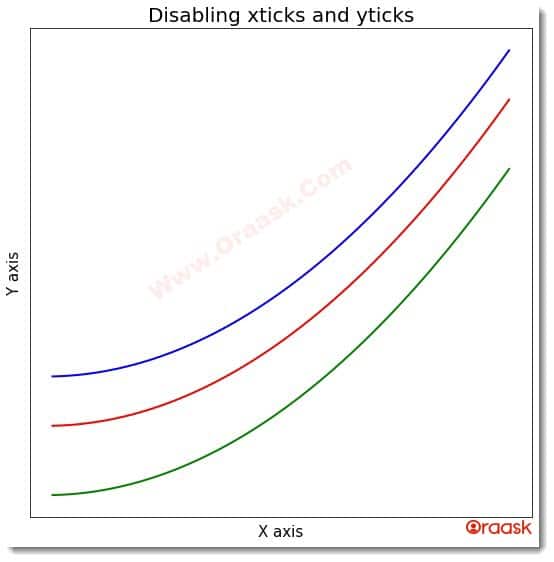
Explanation:
- As customary, we imported the necessary libraries and packages in the code using the import statement. We can import the libraries anywhere in the code, but it is usually recommended to import all the libraries at the top for better code format.
- Now we created a void function named plot_fig(). This function takes four arguments. Under this function, we first created the figure object. We specified the size of the figure using the figsize attribute. We then plotted the three plots using python’s plot() function. We also specified the width of the lines with the linewidth attribute of the plot()function.
- Next, we defined the plot’s title using the title() function. We specified the size of the font using the fontsize attribute.
- We also specified the labels along the axes using the xlabel() and ylabel() functions of matplotlib.
- Finally, using the xticks() and yticks() functions, we removed all the texts along the axis of the plot.
- After the plot_fig() function, we created the main() function, which is the main driving code of the program. Under this function, we used the numpy library to create the data points for the three plots. We used the arrange() function, which takes three arguments: start, end, and step. The start defines the starting number for the iteration to take place; the end defines the number to which the iteration should take place, and the step defines the iterating steps. We also used the power function of numpy. The power function takes two arguments. The first argument is the base, and the second is the power to which the base is to be raised.
- We called the plot_fig() function using the required arguments. Finally, we called the main() function using the following lines of codes: if __name__ == “main“: main()
But what does the function do?
The reality is that the xticks() and yticks() do not have any standard specialized functions to remove all the texts from the plot. The main motive of the functions is to replace the texts and numbers along the axis with some numbers defined by us. But if you keep the values null/empty, then obviously nothing will be displayed, and hence it will appear as if the texts are removed from the plot.
Hide the Axis Text, Keeping the Grid Lines
We also can hide the values along the axes keeping the labels intact. We may need this feature when we are not interested in the values but rather are interested to know about the rough visualization of the plot. However, at the same time, we are also interested to know what we have plotted along the axes.
Example (2)
# Import all the libraries and packages in the code
import matplotlib.pyplot as plt
import numpy as np
# Create a user-defined function named plot_fig
def hide():
    # Create a figure object
    fig = plt.figure(figsize=(9, 9))
    # Create an axes object
    ax = plt.axes()
    # Accessing the frame of the plot
    frame1 = plt.gca()
    # Hiding the texts
    frame1.axes.xaxis.set_ticklabels([])
    frame1.axes.yaxis.set_ticklabels([])
# Creating a user-defined function called plot_figure()
def plot_figure(x, y):
    # Calling the hide() function
    hide()
    # Plotting the figure
    plt.plot(x, y, color="green")
    # Defining the label along the x-axis
    plt.xlabel("This is the x-label")
    # Defining the label along the y-axis
    plt.ylabel("This is the y-label")
    # Defining the title of the plot
    plt.title("Demonstrating how to hide axis in matplotlib")
    # Displaying the plot
    plt.show()
# Defining the main() function
def main():
    # Defining the data points
    x = np.linspace(-100, 100, 1000)
    y = 1/(100+ np.exp(-1*x))
    # Calling the plot_figure() function
    plot_figure(x, y)
# Calling the main() function
if __name__ == "__main__":
    main()
Output:
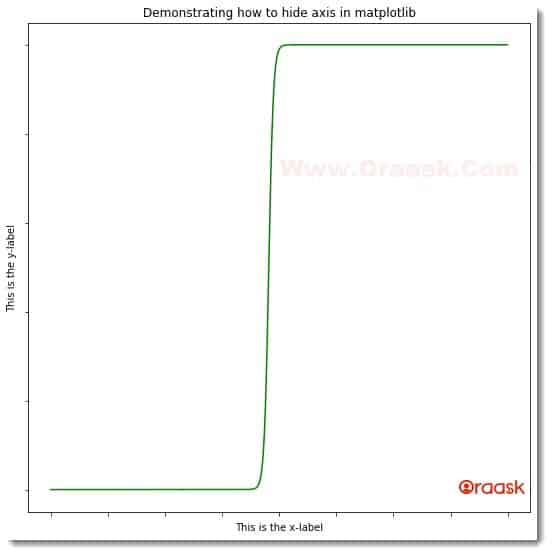
Explanation:
- We imported the matplotlib.pyplot module and the numpy library in the code using the import statement of python.
- Next, we created a user-defined function named hide(). This is a void function. Under this function, we first created the figure object using the figure attribute. We also specified the size of the figure using the figsize attribute of python. Next, we created the axes object using the axes() function. We accessed the frame using the plt.gca() function. Now we used the following code lines to remove the text from the plot: frame1.axes.xaxis.set_ticklabels([]) frame1.axes.yaxis.set_ticklabels([])
- Now we created another user-defined function named plot_figure(). The function takes two parameters, called x and y. Under this function, we first called the hide() function, which we used to hide the texts along the axes. We used the plot() function to plot the figures. Using the xlabel() and the ylabel() functions, we defined the labels along the axes. We used the title() function to define the plot’s title.
- After the plot_figure() function, we created the main() function, which is the main driving code of the program. We created the data points under this function using the numpy array.
- We called the plot_figure() function with appropriate arguments to plot the figure.
- Finally, we called the main() function using the following lines of codes: if __name__ == “main“: main()
Hide Texts After Plotting using subplot() Function
Plotting the figures using the subplot() function is a trendy technique because programmers often need to plot multiple plots in the same workspace. Matplotlib allows us to hide the texts along the axes using ax.spines[\<position>].set_visible(False) function.(Where the position indicates the axes).
Example (3)
# Import the libraries and the packages
import matplotlib.pyplot as plt
import numpy as np
# Creating a user-defined function called hide()
def hide(x, y):
    # Creating the figure object
    fig = plt.figure(figsize=(9, 9))
    # Creating the axes object
    ax = fig.add_subplot(111)
    # Making the texts along the axes invisible
    ax.spines['top'].set_visible(False)
    ax.spines['right'].set_visible(False)
    ax.spines['bottom'].set_visible(False)
    ax.axes.get_xaxis().set_visible(False)
    ax.spines['left'].set_visible(False)
    ax.set_yticklabels([])
    ax.set_yticks([])
    ax.axes.get_yaxis().set_visible(False)
    fig = plt.figure(figsize=(9, 9))
    ax.plot(x, y)
# Defining the main() function
def main():
    # Creating the data points
    x = np.linspace(-100, 100, 1000)
    y = 1/(100 + np.exp(-1*x))
    hide(x, y)
# Callling the min() function
if __name__ == "__main__":
    main()
Output:
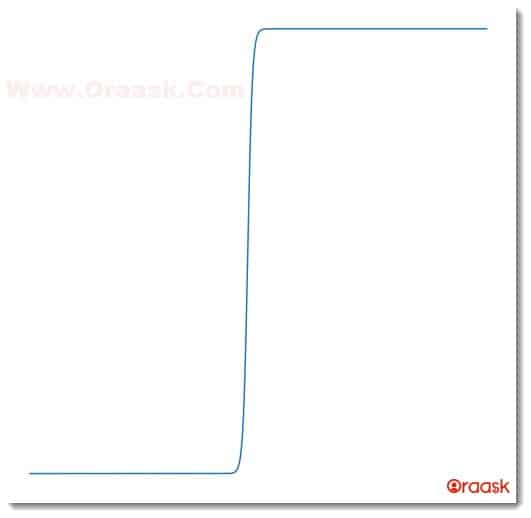
Hiding the Labels from the Axes
We also have the option to hide the labels from the axes. We can either hide both labels or use the xlable=None and ylabl=None attributes.
Hiding x label:
The below code illustrates how to hide the label from the x-axis, only unaffecting the label along the y-axis.
Example (4)
# Import the libraries and the packages
import matplotlib.pyplot as plt
import numpy as np
# Creating a user-defined function called hide()
def hide(x, y):
    # Creating the figure object
    fig = plt.figure(figsize=(9, 9))
    # Creating the axes object
    ax = fig.add_subplot(111)
    # Defining the label along the x-axis
    ax.set_xlabel("This is the x label")
    # Defining the label along the y-axis
    ax.set_ylabel("This is the y label")
    # Hiding the label along the x-axis
    ax.set(xlabel=None)
    # Creating the figure object
    fig = plt.figure(figsize=(9, 9))
    # Plotting the figure
    ax.plot(x, y,color="red")
    # Defining the title of the plot
    ax.set_title("This is the title of the plot")
# Defining the main() function
def main():
    # Creating the data points
    x = np.linspace(-10, 10, 1000)
    y = np.sin(x)
    hide(x, y)
# Callling the min() function
if __name__ == "__main__":
    main()
Output:
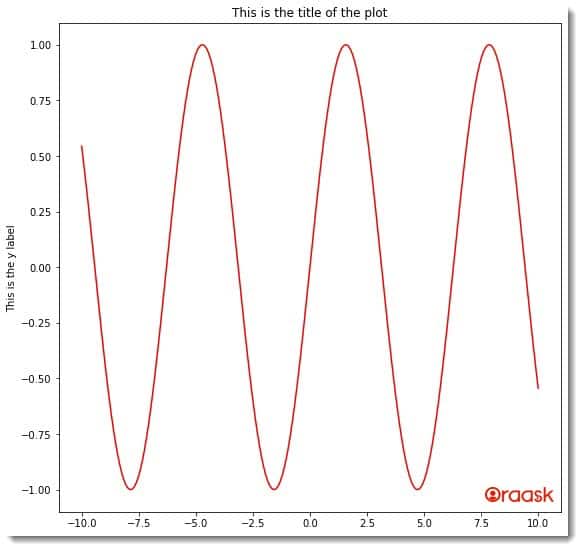
Hiding label from the y-axis:
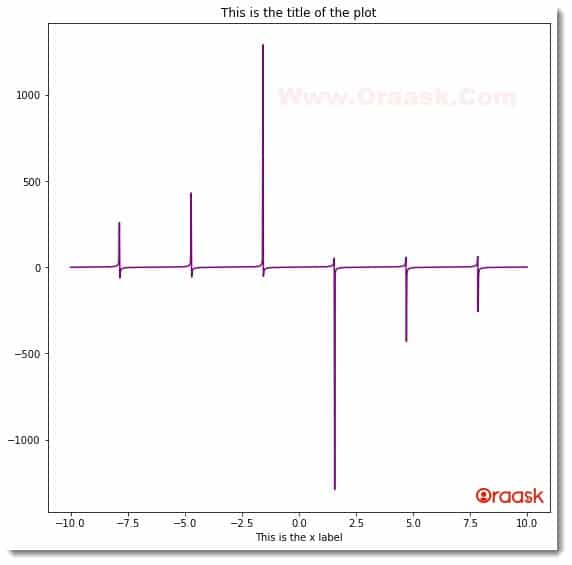
The below code illustrates how to hide the label from the y-axis, only unaffecting the label along the x-axis.
Example (5)
# Import the libraries and the packages
import matplotlib.pyplot as plt
import numpy as np
# Creating a user-defined function called hide()
def hide(x, y):
    # Creating the figure object
    fig = plt.figure(figsize=(9, 9))
    # Creating the axes object
    ax = fig.add_subplot(111)
    # Defining the label along the x-axis
    ax.set_xlabel("This is the x label")
    # Defining the label along the y-axis
    ax.set_ylabel("This is the y label")
    # Hiding the label along the x-axis
    ax.set(ylabel=None)
    # Creating the figure object
    fig = plt.figure(figsize=(9, 9))
    # Plotting the figure
    ax.plot(x, y,color="purple")
    # Defining the title of the plot
    ax.set_title("This is the title of the plot")
# Defining the main() function
def main():
    # Creating the data points
    x = np.linspace(-10, 10, 1000)
    y = np.tan(x)
    hide(x, y)
# Callling the min() function
if __name__ == "__main__":
    main()
Output:
Final Thoughts
In this article, we have understood how to hide the texts in matplotlib using different functions. We used the set_ticklabel() , xticks(), yticks() functions etc. to either directly or indirectly remove the texts from the figure.
We have gone through the basics of the functions and attributes associated with the topic. We strongly recommend that the readers go through the python matplotlib documentation to have more insight into the topic.


