How Can We Help?
Matplotlib allows customizing of plots. From the labels to legends, everything is customizable, whether in terms of color, font, etc. Matplotlib also allows us to invert the axes. Visualizing the figure’s appearance might be required if the axes were inverted.
The need for this concept is to understand different functional transformations in graphs. For example, we can visualize the graph of y=-f(x), y=f(-x) etc. from y=f(x) function with the help of the concept of inversion of the axes.
[adinserter block=”1″]
This article will explain how to invert the x or y axis in matplotlib python.
Usig Invert_Xaxis() And Invert_Yaxis()
We can invert the axis in python matplotlib using the invert_xaxis() and the invert_yaxis() functions of python. While the former inverts the x-axis, the latter inverts the y-axis. The function does not require any other parameter to invert the axes.
Example (1)
# Import all the libraries and packages in the code
import matplotlib.pyplot as plt
import numpy as np
import matplotlib as mpl
# Creating a user-defined function called plot_figure()
def plot_figure(x, y):
    # Create a figure object
    fig = plt.figure(figsize=(9, 9))
    # Create an axes object
    ax = plt.axes()
    # Plotting the figure
    plt.plot(x, y, color="green")
    # Defining the label along the x-axis
    plt.xlabel("This is the x-label")
    # Defining the label along the y-axis
    plt.ylabel("This is the y-label")
    # Defining the title of the plot
    plt.title("Demonstrating how to hide axis in matplotlib")
    ax.invert_xaxis()
    # Displaying the plot
    plt.show()
# Defining the main() function
def main():
    # Defining the data points
    x = np.linspace(-10, 10, 1000)
    y = np.sin(x)
    # Calling the plot_figure() function
    plot_figure(x, y)
# Calling the main() function
if __name__ == "__main__":
    main()
Output:
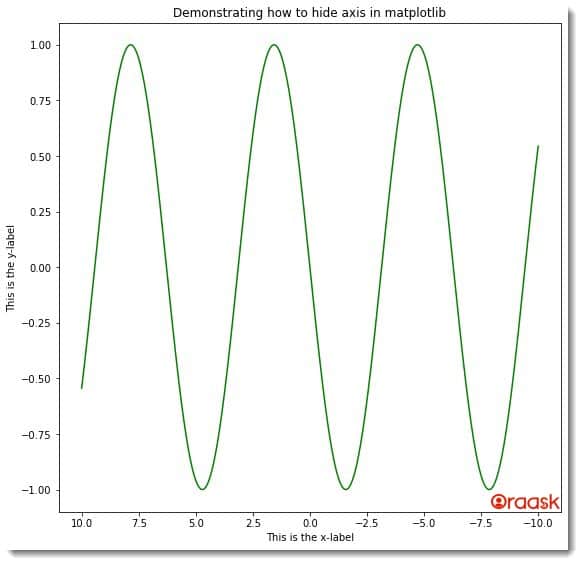
[adinserter block=”2″]
Explanation:
- Using the import statement, we usually imported all the necessary libraries and packages in the code. We imported the matplotlib and numpy library. We also imported a module named matplotlib.pyplot.
- Next we defined another user-defined function named plot_figure(). This is a void function. Under this function, we first created a figure object using the figure() function. We specified the size of the figure using the figsize attribute. Next, we created the plt.axes() function. After creating the axes object, we plotted the graph using the plot() function. We specified the color of the plot using the color attribute.
- We specified the labels of the plot using the xlable() and ylabel() functions. Using the title() function, we also specified the plot’s title.
- Now we used the following commands to invert the x-axis value: ax.invert_xaxis()
- We used the plot.show() function to display the plot. This is, however, optional in Jupyter Notebook.
- Next, we created the main() function. Under this function, we created the data points for the x and the y axis. We called the plot_figure() function with appropriate parameters.
- Finally, using the following lines of codes, we called the main() function: s if __name__ == “main“: main()
Inverting X-Axis Using the Axes Object
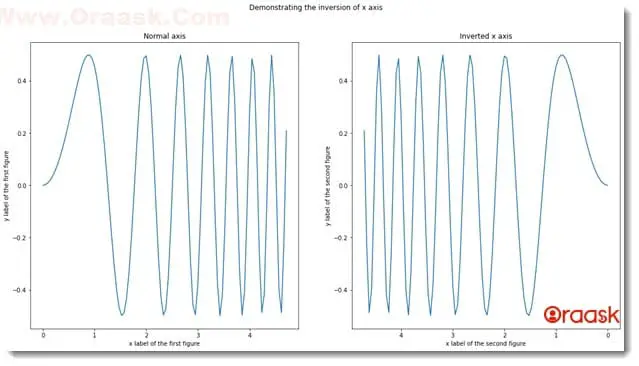
We have pretty other methods to invert the axes. We also plot the figures using the axes objects. The below code implements the same and demonstrates how to invert the x-axis when we plot the data with the help of the axes object.
Example (2)
[adinserter block=”3″]
# Import the libraries and packages in the code
import numpy as np
import matplotlib.pyplot as plt
# Create a user-defined function plot_fig()
def plot_fig(x,y):
    # Create a figure and axes object
    fig, ax = plt.subplots(1, 2,figsize=(18,9))
    # Plotting the first figure
    ax[0].plot(x, y)
    # Defining the title for the first plot
    ax[0].set_title("Normal axis")
    # Defining label along the x-axis for the first plot
    ax[0].set_xlabel("x label of the first figure")
    # Defining label along the y-axis for the first plot
    ax[0].set_ylabel("y label of the first figure")
    # Plotting the second figure
    ax[1].plot(x, y)
    # Inverting the x-axis of the second plot
    ax[1].invert_xaxis()
    # Defining the title for the second plot
    ax[1].set_title("Inverted x-axis")
    # Defining label along the x-axis for the second plot
    ax[1].set_xlabel("x label of the second figure")
    # Defining label along the y-axis for the second plot
    ax[1].set_ylabel("y label of the second figure")
    fig.suptitle("Demonstrating the inversion of x-axis")
    # Displaying the figures
    plt.show()
def main():
# First, create some toy data:
    x = np.linspace(0, 1.5 * np.pi, 100)
    y = np.sin(x**2)*np.cos(x**2)
    plot_fig(x,y)
if __name__ == "__main__":
    main()
Output:
Inverting The Y-Axis Using the axes Object
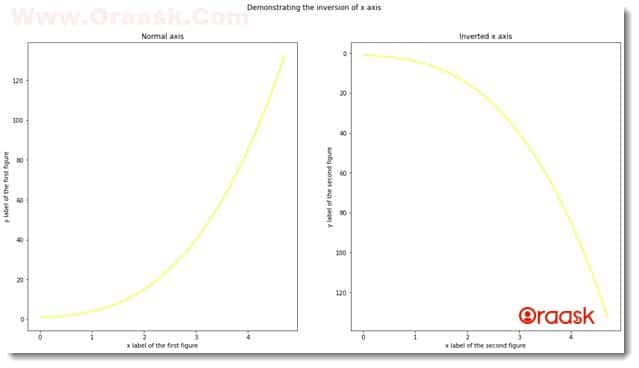
Inversion of the y-axis is equally as easy as inverting the x-axis. We have similar syntax and procedures to invert the y-axis. The below code shows the implementation.
[adinserter block=”4″]
Example (3)
# Import the libraries and packages in the code
import numpy as np
import matplotlib.pyplot as plt
# Create a user-defined function plot_fig()
def plot_fig(x, y):
    # Create a figure and axes object
    fig, ax = plt.subplots(1, 2, figsize=(18, 9))
    # Plotting the first figure
    ax[0].plot(x, y, color="yellow")
    # Defining the title for the first plot
    ax[0].set_title("Normal axis")
    # Defining label along the x-axis for the first plot
    ax[0].set_xlabel("x label of the first figure")
    # Defining label along the y-axis for the first plot
    ax[0].set_ylabel("y label of the first figure")
    # Plotting the second figure
    ax[1].plot(x, y, color="yellow")
    # Inverting the x-axis of the second plot
    ax[1].invert_yaxis()
    # Defining the title for the second plot
    ax[1].set_title("Inverted x-axis")
    # Defining label along the x-axis for the second plot
    ax[1].set_xlabel("x label of the second figure")
    # Defining label along the y-axis for the second plot
    ax[1].set_ylabel("y label of the second figure")
    fig.suptitle("Demonstrating the inversion of x-axis")
    # Displaying the figures
    plt.show()
def main():
    # First, create some toy data:
    x = np.linspace(0, 1.5 * np.pi, 100)
    y = np.power(x, 3)+np.power(x, 2)+np.power(x, 1)+1
    plot_fig(x, y)
if __name__ == "__main__":
    main()
Output:
Using The Xlim And Ylim Functions
[adinserter block=”5″]
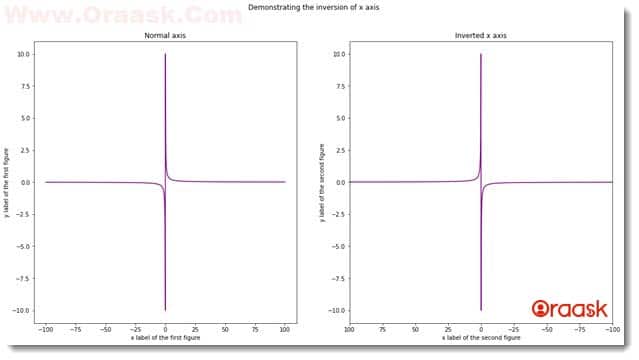
The xlims and ylims functions are used to set limits on the values along the axes. Now we can use our logic to invert the axes. The function takes a list-like object. If we reverse the data points and pass them to the function, the data points along the axes will be inverted.
In the following code, we inverted the x-axis using the xlim() functions:
Example (4)
# Import the libraries and packages in the code
import numpy as np
import matplotlib.pyplot as plt
# Create a user-defined function plot_fig()
def plot_fig(x, y):
    # Create a figure and axes object
    fig, ax = plt.subplots(1, 2, figsize=(18, 9))
    # Plotting the first figure
    ax[0].plot(x, y, color="purple")
    # Defining the title for the first plot
    ax[0].set_title("Normal axis")
    # Defining label along the x-axis for the first plot
    ax[0].set_xlabel("x label of the first figure")
    # Defining label along the y-axis for the first plot
    ax[0].set_ylabel("y label of the first figure")
    # Plotting the second figure
    ax[1].plot(x, y, color="purple")
    # Inverting the x-axis of the second plot
    plt.xlim(max(x), min(x))
    # Defining the title for the second plot
    ax[1].set_title("Inverted x-axis")
    # Defining label along the x-axis for the second plot
    ax[1].set_xlabel("x label of the second figure")
    # Defining label along the y-axis for the second plot
    ax[1].set_ylabel("y label of the second figure")
    fig.suptitle("Demonstrating the inversion of x-axis")
    # Displaying the figures
    plt.show()
def main():
    # First, create some toy data:
    x = np.linspace(-100, 100, 1000)
    y = np.power(x, -1)
    plot_fig(x, y)
if __name__ == "__main__":
    main()
Output:
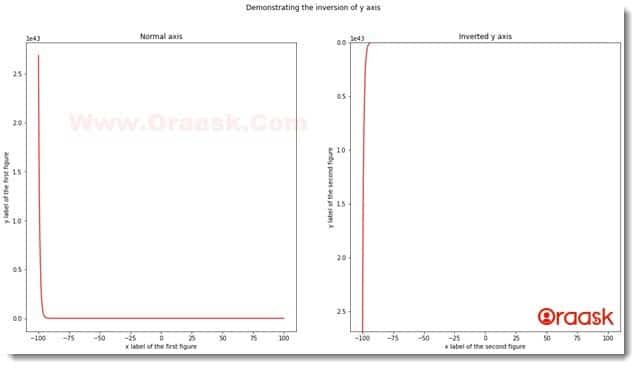
In the following code, we inverted the y-axis and the ylim() functions:
Example (5)
[adinserter block=”6″]
# Import the libraries and packages in the code
import numpy as np
import matplotlib.pyplot as plt
# Create a user-defined function plot_fig()
def plot_fig(x, y):
    # Create a figure and axes object
    fig, ax = plt.subplots(1, 2, figsize=(18, 9))
    # Plotting the first figure
    ax[0].plot(x, y, color="red")
    # Defining the title for the first plot
    ax[0].set_title("Normal axis")
    # Defining label along the x-axis for the first plot
    ax[0].set_xlabel("x label of the first figure")
    # Defining label along the y-axis for the first plot
    ax[0].set_ylabel("y label of the first figure")
    # Plotting the second figure
    ax[1].plot(x, y, color="red")
    # Inverting the x-axis of the second plot
    plt.ylim(max(y), min(y))
    # Defining the title for the second plot
    ax[1].set_title("Inverted y-axis")
    # Defining label along the x-axis for the second plot
    ax[1].set_xlabel("x label of the second figure")
    # Defining label along the y-axis for the second plot
    ax[1].set_ylabel("y label of the second figure")
    fig.suptitle("Demonstrating the inversion of y-axis")
    # Displaying the figures
    plt.show()
def main():
    # First, create some toy data:
    x = np.linspace(-100, 100, 1000)
    y = np.exp(-x)
    plot_fig(x, y)
if __name__ == "__main__":
    main()
Output:
Inverting Both The Axis
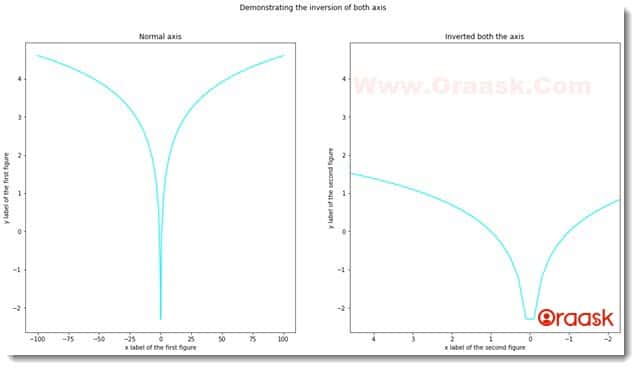
We may require to invert both axes of the plot. Python allows us to do so. We need to call both functions to invert both axes as if they are independent of each other.
[adinserter block=”7″]
Example (6)
# Import the libraries and packages in the code
import numpy as np
import matplotlib.pyplot as plt
# Create a user-defined function plot_fig()
def plot_fig(x, y):
    # Create a figure and axes object
    fig, ax = plt.subplots(1, 2, figsize=(18, 9))
    # Plotting the first figure
    ax[0].plot(x, y, color="cyan")
    # Defining the title for the first plot
    ax[0].set_title("Normal axis")
    # Defining label along the x-axis for the first plot
    ax[0].set_xlabel("x label of the first figure")
    # Defining label along the y-axis for the first plot
    ax[0].set_ylabel("y label of the first figure")
    # Plotting the second figure
    ax[1].plot(x, y, color="cyan")
    # Inverting the x-axis of the second plot
    plt.xlim(max(x), min(x))
    plt.xlim(max(y), min(y))
    # Defining the title for the second plot
    ax[1].set_title("Inverted both the axis")
    # Defining label along the x-axis for the second plot
    ax[1].set_xlabel("x label of the second figure")
    # Defining label along the y-axis for the second plot
    ax[1].set_ylabel("y label of the second figure")
    fig.suptitle("Demonstrating the inversion of both axis")
    # Displaying the figures
    plt.show()
def main():
    # First, create some toy data:
    x = np.linspace(-100, 100, 1000)
    y = np.log(abs(x))
    plot_fig(x, y)
if __name__ == "__main__":
    main()
Output:
Inverting The Axes Through Axis Function
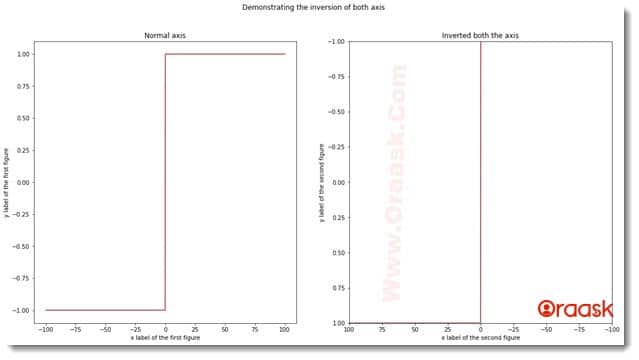
Similar to the plt.xlim() and plt.ylim(), which we used in previous examples, we can also use the axis() function of matplotlib to invert the axes. We need to add the following syntax to the code at the appropriate place:
plt.axis([max(x), min(x), max(y), min(y)])Here we are giving four arguments. We are placing the maximum value of the x-axis at first and the minimum value later. As a result, the axes will get the values in reverse order. We did a similar procedure for the y-axis.
[adinserter block=”8″]
Example (7)
# Import the libraries and packages in the code
import numpy as np
import matplotlib.pyplot as plt
# Create a user-defined function plot_fig()
def plot_fig(x, y):
    # Create a figure and axes object
    fig, ax = plt.subplots(1, 2, figsize=(18, 9))
    # Plotting the first figure
    ax[0].plot(x, y, color="brown")
    # Defining the title for the first plot
    ax[0].set_title("Normal axis")
    # Defining label along the x-axis for the first plot
    ax[0].set_xlabel("x label of the first figure")
    # Defining label along the y-axis for the first plot
    ax[0].set_ylabel("y label of the first figure")
    # Plotting the second figure
    ax[1].plot(x, y, color="brown")
    # Inverting the x-axis of the second plot
    plt.axis([max(x), min(x), max(y), min(y)])
    # Defining the title for the second plot
    ax[1].set_title("Inverted both the axis")
    # Defining label along the x-axis for the second plot
    ax[1].set_xlabel("x label of the second figure")
    # Defining label along the y-axis for the second plot
    ax[1].set_ylabel("y label of the second figure")
    fig.suptitle("Demonstrating the inversion of both axis")
    # Displaying the figures
    plt.show()
def main():
    # First, create some toy data:
    x = np.linspace(-100, 100, 1000)
    y=[]
    for i in x:
        if(i<0):
            y.append(-1)
        else:
            y.append(1)
    plot_fig(x, y)
if __name__ == "__main__":
    main()
Output:
Explanation:
[adinserter block=”9″]
- As customary, we first imported the libraries using the import statement of python. We imported the numpy library and matplotlib.pyplot module.
- Next we created a user-defined function named plot_fig(). This void function takes two parameters, namely x and y.
- Under the function, we first created the figure and the axes object using the plt.subplot() function. We specified the size of the plot using the figsize attribute. We passed 1,2 arguments to this function. This means we created a one-dimensional plot space with two columns.
- We used the ax[0] to plot the first figure. We passed the value of x and y to the plot() function. We specified the color of the argument using the color attribute.
- We also set the labels along the axes using the ax.set_xlabel() and ax.ylabel() functions. Similarly, we plotted the second plot using the ax[1] object.
- We provided the title of the whole figure using the suptitle() function. We displayed the plot using the plt.show() function.
- After the plot_fig() function, we created the main() function, which is the driving code of the program. Under this function, we first created a numpy array for the x-axis. We created an empty list for the y-axis and named it y. We traversed through the values of x and appended -1 to y whenever the value of the element in x was less than 0. Otherwise, we appended 1 to y.
- We called the plot_fig() function to plot the graph.
- Finally, we called the main()( function using the following lines of codes: if __name__ == “main“: main()
But Why Want To Invert The Axes
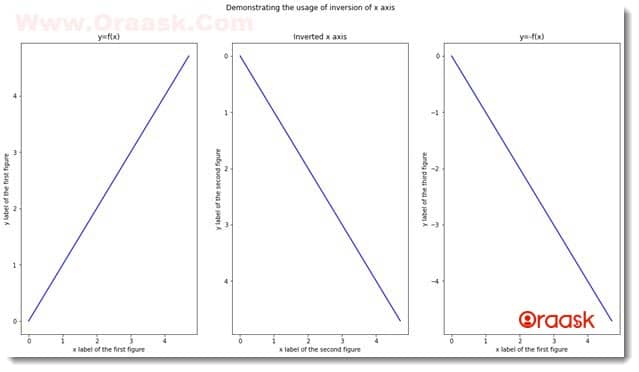
The inversion of the axis has great significance in the field of mathematics.
For example, suppose we have a graph y=f(x) and we need y=-f(x). We need to flip the f(x) along the x-axis.
Example (8)
# Import the libraries and packages in the code
import numpy as np
import matplotlib.pyplot as plt
# Create a user-defined function plot_fig()
def plot_fig(x, y1,y2):
    # Create a figure and axes object
    fig, ax = plt.subplots(1, 3, figsize=(18, 9))
    # Plotting the first figure
    ax[0].plot(x, y1, color="blue")
    # Defining the title for the first plot
    ax[0].set_title("y=f(x)")
    # Defining label along the x-axis for the first plot
    ax[0].set_xlabel("x label of the first figure")
    # Defining label along the y-axis for the first plot
    ax[0].set_ylabel("y label of the first figure")
    # Plotting the second figure
    ax[1].plot(x, y1, color="blue")
    # Inverting the x-axis of the second plot
    ax[1].invert_yaxis()
    # Defining the title for the second plot
    ax[1].set_title("Inverted x-axis")
    # Defining label along the x-axis for the second plot
    ax[1].set_xlabel("x label of the second figure")
    # Defining label along the y-axis for the second plot
    ax[1].set_ylabel("y label of the second figure")
    ax[2].plot(x, y2, color="blue")
    # Defining the title for the first plot
    ax[2].set_title("y=-f(x)")
    # Defining label along the x-axis for the first plot
    ax[2].set_xlabel("x label of the first figure")
    # Defining label along the y-axis for the first plot
    ax[2].set_ylabel("y label of the third figure")
    fig.suptitle("Demonstrating the usage of inversion of x-axis")
    # Displaying the figures
    plt.show()
def main():
    # First, create some toy data:
    x = np.linspace(0, 1.5 * np.pi, 100)
    y1 = x
    y2 = -1*x
    plot_fig(x, y1,y2)
if __name__ == "__main__":
    main()
Output:
[adinserter block=”10″]
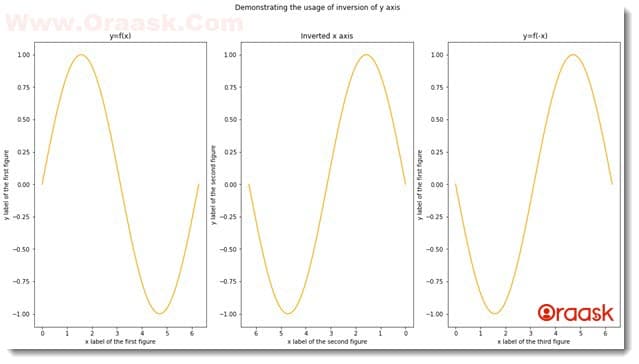
Suppose we have the function y=f(x) and we want to plot the graph y=f(-x). We need to flip the graph along the y-axis.
Example (9)
# Import the libraries and packages in the code
import numpy as np
import matplotlib.pyplot as plt
# Create a user-defined function plot_fig()
def plot_fig(x, y1,y2):
    # Create a figure and axes object
    fig, ax = plt.subplots(1, 3, figsize=(18, 9))
    # Plotting the first figure
    ax[0].plot(x, y1, color="orange")
    # Defining the title for the first plot
    ax[0].set_title("y=f(x)")
    # Defining label along the x-axis for the first plot
    ax[0].set_xlabel("x label of the first figure")
    # Defining label along the y-axis for the first plot
    ax[0].set_ylabel("y label of the first figure")
    # Plotting the second figure
    ax[1].plot(x, y1, color="orange")
    # Inverting the x-axis of the second plot
    ax[1].invert_xaxis()
    # Defining the title for the second plot
    ax[1].set_title("Inverted x-axis")
    # Defining label along the x-axis for the second plot
    ax[1].set_xlabel("x label of the second figure")
    # Defining label along the y-axis for the second plot
    ax[1].set_ylabel("y label of the second figure")
    ax[2].plot(x, y2, color="orange")
    # Defining the title for the first plot
    ax[2].set_title(" y=f(-x)")
    # Defining label along the x-axis for the first plot
    ax[2].set_xlabel("x label of the third figure")
    # Defining label along the y-axis for the first plot
    ax[2].set_ylabel("y label of the first figure")
    fig.suptitle("Demonstrating the usage of inversion of y-axis")
    # Displaying the figures
    plt.show()
def main():
    # First, create some toy data:
    x = np.linspace(0, 2 * np.pi, 100)
    y1 = np.sin(x)
    y2 = np.sin(-x)
    plot_fig(x, y1,y2)
if __name__ == "__main__":
    main()
[adinserter block=”1″]
Output:
Final Thoughts
In this article, we learned how to invert the axes of the plots using many functions of matplotlib available use. We both used standard as well as indirect functions to achieve the same. We used the xlim(), ylim(),axis(), ax.invert_xaxis(), ax.invert_yaxis() functions etc. to invert the axes. We also learned how to use the associated functions and attributes it.
We have discussed a large number of functions and associated attributes. However, we strongly recommend that the readers go through python matplotlib documentation to know more about the functions and attributes.
[adinserter block=”2″]


