How Can We Help?
Matplotlib library in python offers us a variety of ways to plot almost anything related to the plotting of data, animations, etc. Programmers often may need to plot line graphs in three-dimensional plots. In real life, it is extensively used for looking into the co-relation of data with independent variables and the associated functions. A line plot is a plot in which there are straight points, or the points are connected with lines. When such a plot is done in three-dimensional space, it is called a 3D line plot.
This article will teach us how to plot a 3D line graph in matplotlib in more detail.
How to Plot a Simple Three-Dimensional Line Graph in Matplotlib
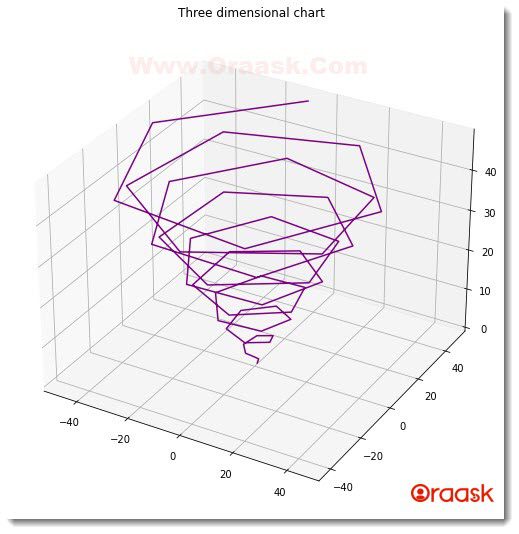
We can plot a three-dimensional line graph in matplotlib using the plot3D() function. We can use all other functions associated with the two-dimensional line chart available in matplotlib, like defining the title, labels, legends to the plot, etc.
Example (1)
# importing mplot3d toolkits, numpy, and matplotlib
from mpl_toolkits import mplot3d
import numpy as np
import matplotlib.pyplot as plt

#defining a user-defined function named three_dimensional_line
def three_dimensional_line(x,y,z):
    #creating the figure
    fig = plt.figure(figsize=(9,9))
    #creating the three-dimensional workspace
    ax = plt.axes(projection ='3d')
    #plotting the graph
    ax.plot3D(x, y, z, 'purple')
    #setting title to the plot
    ax.set_title('Three dimensional chart')
    #displaying the plot
    plt.show()

#defining the main() function
def main():
    #creating data points for the z-axis
    z = np.arange(0, 50, 1)
    #creating data points for the x-axis
    x = z * np.sin(20 * z)+np.cos(z*20)
    #creating data points for the y-axis
    y = z * np.cos(20 * z)
    #calling the three_dimensional_line() function
    three_dimensional_line(x,y,z)

#calling the main() function
if __name__ == "__main__":
    main()
Output:

Explanation:
- First, we imported all the necessary libraries and packages in our code using the import statement of python. We imported one library here, namely numpy. The other two are python modules of python libraries.
- Next we created a user-defined function named three_dimenisonal_line().It takes three parameters, namely x,y, and z. Under the function, we first created a figure object using the figure() function of matplotlib. We have set the size of the plot using the figsize attribute. Next, we created the axes class using the axes() function. We have passed the attribute projection=”3d” to the function to make the plot three-dimensional. Next, we plotted the graph by using the plot3D() function. We have also set the color of the line as purple. This is optional, and by default, it is blue.
- Next, we set the title for the plot using the plt.plot() function. Finally, we displayed the graph using the plt. show() function. Note that this is optional in a Jupyter Notebook.
- Next, we defined the main() function, which is the main driving code of the program. Under this function, we first created data points for the z-axis using the numpy library. We have passed three parameters 0,50,1. The first number defines the initial number to start with. The second number defines the last number for iterations, and the third number defines the iterating step.
- We created data points for the x and y axis similar to z. Then we called the three_dimensional_lines() function by passing all the necessary arguments in the code.
- Finally, we called the main() function the main driving code of the program using the following lines of codes:
if __name__ == “__main__”:
main()
Creating Simple Line Charts in Three Dimensions
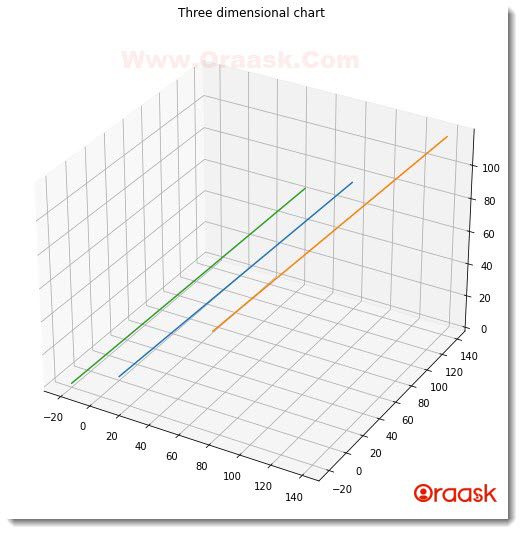
It is pretty easy to plot simple line charts in three dimensions. We must create the data points first with some numpy-like object or list data type. Then we need to define three parameters least for each plot in the figure. Then we can use the plot3D() function to plot the line graphs in the figure. We can other parameters and attributes depending upon the requirements.
Example (2)
import matplotlib.pyplot as plt
import numpy as np
#creating data points for the z1 axis
z1 = np.arange(0,100,1)
#creating data points for the x1 axis
x1 = z1
#creating data points for the y1 axis
y1 = z1
#creating data points for the z2 axis
z2 = np.arange(0,100,1)+20
#creating data points for the x2 axis
x2 = z2+20
#creating data points for the y2 axis
y2 = z2+20
#creating data points for the z3 axis
z3 = np.arange(0,100,1)
#creating data points for the x3 axis
x3 = z3-20
#creating data points for the y3 axis
y3 = z3-20
#creating the figure
fig = plt.figure(figsize=(9,9))
#creating a three-dimensional workspace
ax = plt.axes(projection ='3d')
#plotting the graph
ax.plot3D(x1, y1,z1)
ax.plot3D(x2, y2,z2)
ax.plot3D(x3, y3,z3)
#setting title to the plot
ax.set_title('Three dimensional chart')
#displaying the plot
plt.show()
Output:

Explanation:
- As customary, we first imported the necessary libraries and packages in the code using the import function of python. We imported matplotlib.pyplot module and numpy library in the code.
- Next, we created data points for the x,y, and z axis for each plot. We used the arange() function to create data points in the code. The arange function takes three parameters. The first parameter defines the starting number for the iteration; the second number defines the last number up to which the iteration should take place. The third parameter defines the step for each iteration. We have created a total of three different sets of data points to plot three different plots.
- Next, we created the figure object and set the size of the figure. We created axes objects to create a three-dimensional workspace. Then using the plot3D() function, we plotted the graphs. Next, we set the title to the graph using the set_title() function. Finally, we displayed the plot using the plt.show() function.
How to Plot Multiple 3D Plots in Matplotlib
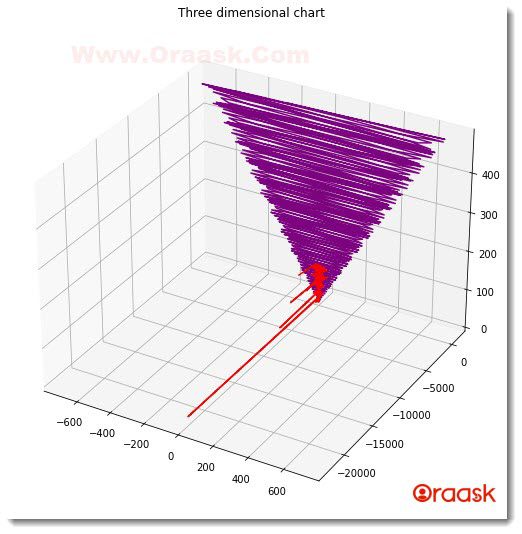
Creating multiple 3D plots in matplotlib is simple. This can be done by adding multiple plot3D() functions and adding valid parameters in the code. We can use all the functions and attributes available for the two-dimensional line graph.
Example (3)
# importing numpy and matplotlib
import numpy as np
import matplotlib.pyplot as plt

#defining a user-defined dunction named three_dimensional_line
def three_dimensional_line(x1,y1,z1,x2,y2,z2):
    #creating the figure
    fig = plt.figure(figsize=(9,9))
    #creating a three-dimensional workspace
    ax = plt.axes(projection ='3d')
    #plotting the graph
    ax.plot3D(x1, y1, z1, 'purple')
    ax.plot3D(x2, y2, z2, 'red')
    #setting title to the plot
    ax.set_title('Three dimensional chart')
    #displaying the plot
    plt.show()

#defining the main() function
def main():
    #creating data points for the z1 axis
    z1 = np.arange(0, 500, 1)
    #creating data points for the x1 axis
    x1 = z1 * (np.sin(z1)+np.cos(z1))
    #creating data points for the y1 axis
    y1 = z1 * np.cos(20 * z1)
    #creating data points for the z2-axis
    z2 = np.arange(0, 100, 1)
    #creating data points for the x2-axis
    x2 = z2 * np.sin(z2)*np.cos(20)
    #creating data points for the y2-axis
    y2 = 100*np.tan(z2)
    #calling the three_dimensional_line() function
    three_dimensional_line(x1,y1,z1,x2,y2,z2)

#calling the main() function
if __name__ == "__main__":
    main()
Output:

Explanation:
- First, we imported all the necessary libraries and packages in our code using the import statement of python. We imported the libraries using their alias names for convenience while further writing codes in our program.
- Next we created a user-defined function named three_dimensional_line() function which takes six parameters namely x1,y1,z1,x2,y2,z2.Under this function, we have created a figure class using the plt.figure() function of matplotlib. The figure function takes tuples as the accepted values. Next, we created the axes class for three-dimensional projection in our plot. Then we plotted the graphs. We used the plot3D() function twice because we are plotting two different plots in the same figure. Note that we can plot as many plots as required in the same figure in matplotlib. We set the title for the plot using the set_title() function. We could also have used the plt.title() function.
- Next, we created the main() function. Under this function, we created data points for the x,y, and z axis for each of the plots using numpy arrays. We called the three_dimensional_line() function after passing all the necessary parameters.
- Finally, we declared the main() function as the driving code of the program using the following lines of codes:
if __name__ == “__main__”:
main()
Check This: There is a full guide on Matplotlib 3D Bar Chart if you want to know more about 3D Charts.
Adding Legends to the 3D Line Graph
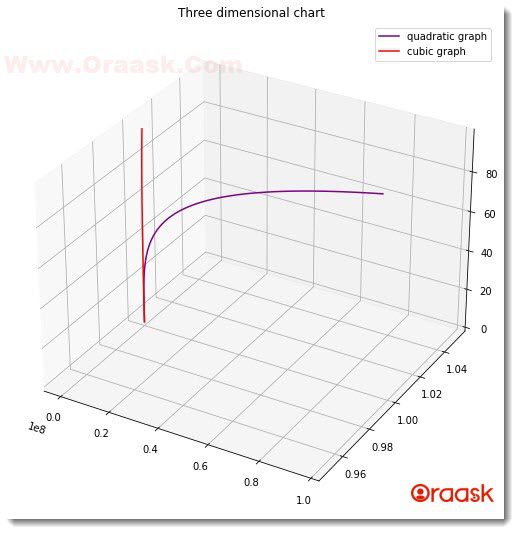
Whenever there are multiple line plots in the graph, it is a good idea to segregate the plots by using different colors for each. This will make the visualization process much better.
Example (4)
# importing mplot3d toolkits, numpy, and matplotlib
import numpy as np
import matplotlib.pyplot as plt

#defining a user-defined dunction named three_dimensional_line
def three_dimensional_line(x1,y1,z1,x2,y2,z2):
    #creating the figure
    fig = plt.figure(figsize=(9,9))
    #creating a three-dimensional workspace
    ax = plt.axes(projection ='3d')
    #plotting the graph
    ax.plot3D(x1, y1, z1, 'purple')
    ax.plot3D(x2, y2, z2, 'red')
    #setting title to the plot
    ax.set_title('Three dimensional chart')
    plt.legend(["quadratic graph","cubic graph"])
    #displaying the plot
    plt.show()

#defining the main() function
def main():
    #creating data points for the z1 axis
    z1 = np.arange(0, 100, 1)
    #creating data points for the x1 axis
    x1 = np.power(z1,4)
    #creating data points for the y1 axis
    y1 = np.ones(100)
    #creating data points for the z2-axis
    z2 = np.arange(0, 100, 1)
    #creating data points for the x2-axis
    x2 = np.power(z2,3)
    #creating data points for the y2-axis
    y2 = np.ones(100)
    #calling the three_dimensional_line() function
    three_dimensional_line(x1,y1,z1,x2,y2,z2)

#calling the main() function
if __name__ == "__main__":
    main()
Output:

Explanation:
- First, we imported the numpy and the matplotlib.pyplot using the import statement of python.
- Next we created three_dimensional_line() function which takes six parameters namely x1,y1,z1,x2,y2,z2.Under this function, we created a figure object using the figure() function and changed its dimensions. Next, we created the axes object and passed the parameter projection=”3d”.Next, we plotted the graphs using the plot3D() function. We have similarly plotted two graphs. We passed different colors to them to make them distinct and for better data visualization.
- Next, we set the title to the plot using the ax.set_title() command.
- Now we set the legends to the plot using the legend() function. We passed the legends in the form of strings within the list.
- Next, we created the main() function. Under this function, we have created the data points for the x,y, and z axis for both plots. We used the numpy library for generating the data points. We used the arange() function, which takes three arguments. They start, stop and step accordingly. We used the power() function to obtain the graph of polynomial functions. The power function takes two arguments. The first argument is the variable or some constant to act as the base, and the second argument is the power to which we need to evaluate the value.
- We also used another function named ones() which created a numpy array with 1 as the only element. It takes only one argument, which is the required number of ones. The syntax is as follows:
np. ones(<number of ones required>)
- Next, we called the three_dimensional_line() function by passing all the necessary arguments in the code.
- Finally, we called the main() function using the following lines of codes:
if __name__ == “__main__”:
main()
Conclusion:
This article taught us how to plot a three-dimensional line plot.We used many functions and attributes associated with it like plot3D(),title(),ones() etc.We used numpy and matplotlib libraries to plt the graphs.
Although we have covered most of the critical topics, we strongly recommend the readers to kook up the python matplotlib documentation to have more knowledge of the associated functions and attributes.


