How Can We Help?
Matplotlib is a compelling library of python for data visualization. It’s widely used in business, economics, etc. The pie chart is a special kind of chart in which the data is represented through a circular chart, and the sectors represent the share of the data points as a whole. This describes the share of sectors out of the total circular region.
What is a Nested Pie Chart in Matplotlib?
A nested pie chart is a pie chart in which multiple pie charts are embedded. We can explain it as an analogy with nested lists. We use it to represent the data at multiple levels in the plot.
What is the use of the Nested Pie Chart in Matplotlib?
Nested pie charts are handy when we want to plot pie charts with other constraints present.
For example, Suppose a company wants to plot a pie chart and analyze the data of the share of sales distribution of different products over the past 10 years. Then one way of doing this is to make 10 different pie plots. However, this seems to be not a clear idea. A much better idea would be to plot all the pie charts in a single graph so we can better visualize the data.
Plotting a Simple Nested Pie Chart:
Plotting a simple nested pie chart is simple. We need to keep in mind the following points to plot a nested pie chart:
- We need to pass the multiple pie () function to plot multiple pie charts in the figure.
- Next, we also need to pass another attribute about the radius of the pie chart. The radius of each pie chart should be distinct; otherwise, they will overlap each other, and hence we will be able to visualize only one pie chart.
Example (1)
#import all the necessary libraries and modules
import matplotlib.pyplot as plt
import numpy as np
#creating a user-defined function named nested_pie()
def nested_pie(x,y,z,labelx,labely,labelz,size):
    #creating figure object
    fig=plt.figure(figsize=(5,10))
    #creating the axis with 4 parameters passed
    ax=fig.add_axes([0,0,1,1])
    #creating the outermost pie chart
    ax.pie(x,radius=size,labels=labelx)
    #creating the middle pie chart
    ax.pie(y,radius=size-0.3,labels=labely)
    #creating the smallesst pie chart
    ax.pie(z,radius=size-0.6,labels=labelz)
def main():
    #creating data point for the outermost pie chart
    salary1=[78000,89000,97000,68000,85000]
    label1=["john","simon","smith","richard","brine"]
    #creating data point for the middle pie chart
    salary2=[58000,49000,63000,68000,45000]
    label2=["elsa","steve","micheal","johnson","jakson"]
    #creating data point for the pie chart with the least radius
    salary3=[86000,89000,97000,92000,98000]
    label3=["willy","tesla","williamson","dextro","rayan"]
    #defining the size or the pie chart
    size=1
    #calling the nested_pie() function
    nested_pie(salary1,salary2,salary3,label1,label2,label3,size)
#declaring the main() function as the main driving code of the program.
if __name__ == "__main__":
    main()
Output:
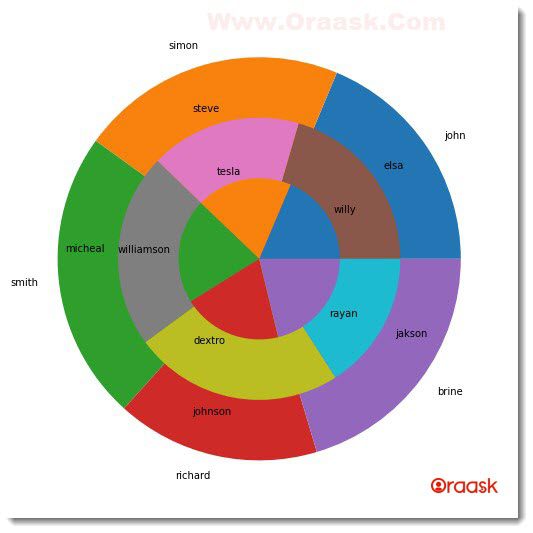
Explanation:
- We first imported all the necessary libraries and modules into the code using the import statement of python. We used the aliasing names technique to make it more convenient to use the libraries further.
- Next, we created a user-defined function named nested_pie (). This function can take seven arguments: x,y,z, label x, label y, labelz, and size. Under the function, we first created the figure object. We did it with the help of the figure object in python. We have passed the figure size to the figure using the figsize attribute. Next, we also created axes using the add_axes () function.
- After that, we plotted the pie charts one by one using the ax.pie() function. We used the function three times because we wanted to plot three different pie charts as nested pie charts. Under each of the functions, we passed the attributes. First, we passed the data points in the form of a list. Next, we passed the radius of the pie charts. Notice the first pie chart. We only used the size parameter as the radius value. For the second one we used, we used (size-0.3); finally, for the innermost part, we used (size-0.6) as the radius value. Additionally, we also added another attribute named labels to the functions.
- We then created the main () function, which does not take any parameter. Under this function, we created the data points for the pie chart and associated labels. We first created a list for all three data points r converted it into numpy arrays. Next, we called the nested_pie ()) function with all the necessary arguments passed.
- Finally, we declared the main() function as the driving code of the program using the following lines of codes:
if __name__ == “__main__”:
main ()
Check This: We have a full guide on Matplotlib Pie Chart
Plot a Nested Pie Chart from a Data Frame
Sometimes we need to plot data frames. Data frames are extensively used in the machine learning field, where there is a need to deal with a large chunk of data. We can also plot the data frames in python using the pie () function. We should only remember that we need to get the desired parameters through python’s iloc() function.
Example(2)
#import all the necessary libraries and modules
import matplotlib.pyplot as plt
import numpy as np
import pandas as pd
#creating a user-defined function named nested_pie()
def nested_pie(x1,x2,x3,size,df):
    #creating figure object
    fig=plt.figure(figsize=(5,10))
    #creating the axis with 4 parameters passed
    ax=fig.add_axes([0,0,1,1])
    #creating the outermost pie chart
    ax.pie(x1,radius=size,labels=df.iloc[0:3,0])
    #creating the middle pie chart
    ax.pie(x2,radius=size-0.3,labels=df.iloc[0:3,0])
    # ax.pie(x3,radius=size-0.6)
    ax.pie(x3,radius=size-0.6,labels=df.iloc[0:3,0])
    #creating the title of the chart.
    plt.title("Demonstrating the nested pie chart using data frame")

def main():
    marks_of_students={'students':['jakson','richard','bobin',"tesla"],
    'mathematics':[78,86,79,89],
    'science':[72,86,79,76],
    'history':[89,97,95,78]}
    df=pd.DataFrame(marks_of_students,columns=['students','mathematics','science','history'])
    x1= df.iloc[0:3,1]
    x2= df.iloc[0:3,2]
    x3= df.iloc[0:3,3]
    size=1
    nested_pie(x1,x2,x3,size,df)
#declaring the main() function as the main driving code of the program.
if __name__ == "__main__":
    main ()
Output:
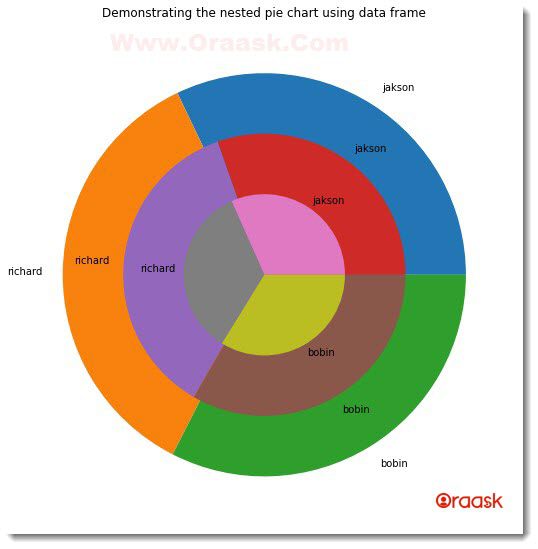
Explanation:
- First, import all the necessary libraries and modules in the code using the import statement as customary. We have imported matplotlib.plyplot, numpy, and pandas libraries using their aliasing names. Note that we can set the alias names on our own.
- Next we created a user-defined function named nested_pie () which takes 5 parameters namely x1,x2,x3,size,df.Under this function, we created a figure object using the plt.figure() function and added the figsize attribute to set the size of the plot.
- Next, we created the plot’s axes using the add_axes () function. After that, we plotted the three pie charts using the ax.pie() function. Under each function, we passed three attributes. First, we passed the numeric data points to be plotted in the figure as the pie chart. Next, we used the radius attribute to define different radii for each pie chart. And at last, we passed labels to the pie chart using the df.iloc() function.
- We also set the title to the plot using the plt.title() function of matplotlib.pyplot module.
- Next, we created the main () function. This is the main part of the program. Under this function, we created a dictionary named marks_of_students. Next, we used the pandas library to create a data frame for the data. We used the pd.DataFrame() function for the same. Under this function, we passed the dictionary’s name as the parameter and used the column attribute to define the columns of the data frame.
- We then created three variables, namely x1, x2, and x3, representing the data points for the three pie charts. We used the iloc() function to trim the data frame and store the data frame’s first, second, and third elements.
- We also defined the size for the chart as 1(value). Now we called the nested_pie () function by passing all the necessary arguments in the function.
- Finally, we called the main () function using the following lines of codes:
if __name__ == “__main__”:
main ()
Plot Nested Pie Chart with Label:
Labeling the nested pie chart is simple. Just add the labels attribute to the pie () function. We only need to pass the labels with some array-like objects, lists, etc. Adding labels is crucial because they tell us what the particular sector represents in the chart.
Example (3)
#import all the necessary libraries and modules
import matplotlib.pyplot as plt
import numpy as np
#creating a user-defined function named nested_pie()
def nested_pie(x,y,z,labelx,labely,labelz,size):
    #creating figure object
    fig=plt.figure(figsize=(10,10))
    #creating the axis with 4 parameters passed
    ax=fig.add_axes([0,0,1,1])
    #creating the outermost pie chart
    ax.pie(x,radius=size,labels=labelx)
    #creating the middle pie chart
    ax.pie(y,radius=size-0.25,labels=labely)
    #creating the smallesst pie chart
    ax.pie(z,radius=size-0.5,labels=labelz)
def main():
    #creating data point for the outermost pie chart
    product1=np.array([2,2,5,3,2])
    label1=["2010","2012","2013","2014","2015"]
    #creating data point for the middle pie chart
    product2=np.array([4,8,6,5,4])
    label2=["2010","2012","2013","2014","2015"]
    #creating data point for the pie chart with the least radius
    product3=np.array([7,4,4,8,9])
    label3=["2010","2012","2013","2014","2015"]
    #defining the size or the pie chart
    size=1
    #calling the nested_pie() function
    nested_pie(product1,product2,product3,label1,label2,label3,size)
#declaring main() function as the main driving code of the program.
if __name__ == "__main__":
    main ()
Output:
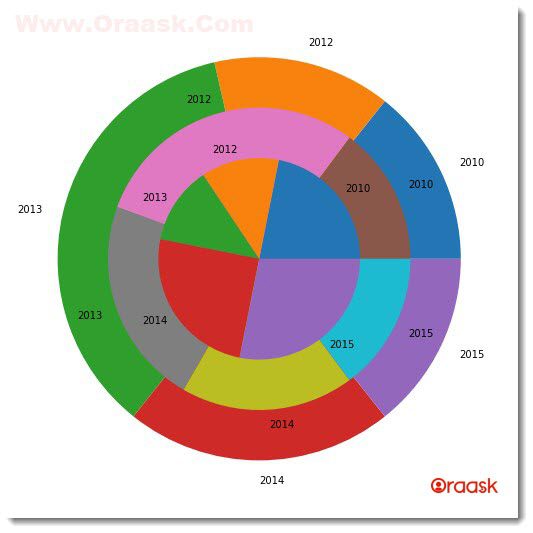
Change Label Position of Nested Pie Chart:
It is often seen that although we set the labels attribute to the pie () function, the labels are not in the desired position. Instead, the labels seem to be in some unconventional position. As a coder, we can customize the position of the nested pie charts in the code. This can be done by passing the labeldistance attribute of matplotlib. The attribute takes the float type of number as its value.
Example (4)
#import all the necessary libraries and modules
import matplotlib.pyplot as plt
import numpy as np
#creating a user-defined function named nested_pie()
def nested_pie(x,y,z,labelx,labely,labelz,size):
    #creating figure object
    fig=plt.figure(figsize=(10,10))
    #creating the axis with 4 parameters passed
    ax=fig.add_axes([0,0,1,1])
    #creating the outermost pie chart
    ax.pie(x,radius=size,labels=labelx,labeldistance=0.9)
    #creating the middle pie chart
    ax.pie(y,radius=size-0.25,labels=labely,labeldistance=0.75)
    #creating the smallest pie chart
    ax.pie(z,radius=size-0.5,labels=labelz,labeldistance=0.50)
def main():
    #creating data point for the outermost pie chart
    product1=np.array([2,2,5,3,2])
    label1=["2010","2012","2013","2014","2015"]
    #creating data point for the middle pie chart
    product2=np.array([4,8,6,5,4])
    label2=["2010","2012","2013","2014","2015"]
    #creating data point for the pie chart with the least radius
    product3=np.array([7,4,4,8,9])
    label3=["2010","2012","2013","2014","2015"]
    #defining the size or the pie chart
    size=1
    #calling the nested_pie() function
    nested_pie(product1,product2,product3,label1,label2,label3,size)
#declaring main() function as the main driving code of the program.
if __name__ == "__main__":
    main ()
Output:
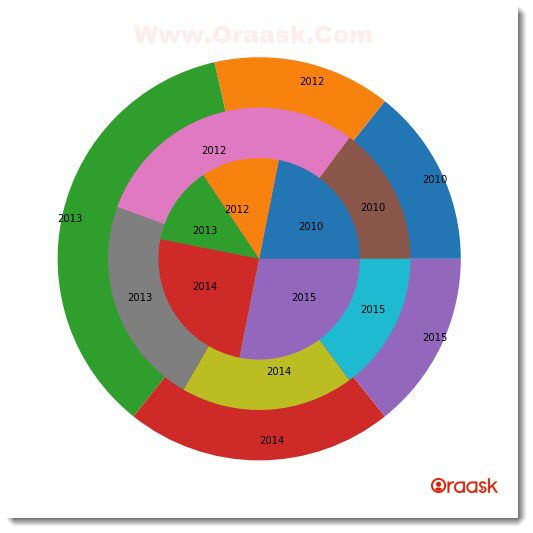
Plot Nested Pie Chart with Values:
Sometimes we may want to plot the nested pie charts with the values to be displayed instead of any labels. One way of doing this is simply passing the values to the label attribute instead of creating another label. We can set the values of the label’s attributes as the x values.
Example (5)
#import all the necessary libraries and modules
import matplotlib.pyplot as plt
import numpy as np
#creating a user-defined function named nested_pie()
def nested_pie(x,y,z,size):
    #creating figure object
    fig=plt.figure(figsize=(10,10))
    #creating the axis with 4 parameters passed
    ax=fig.add_axes([0,0,1,1])
    #creating the outermost pie chart
    ax.pie(x,radius=size,labels=x,labeldistance=0.9)
    #creating the middle pie chart
    ax.pie(y,radius=size-0.25,labels=y,labeldistance=0.75)
    #creating the smallest pie chart
    ax.pie(z,radius=size-0.5,labels=z,labeldistance=0.50)
    #Giving a title to the plot
    plt.title("Demonstrating the nested pie chart")
def main():
    #creating data point for the outermost pie chart
    product1=np.array([2,2,5,3,2])
    #creating data point for the middle pie chart
    product2=np.array([4,8,6,5,4])
    #creating data point for the pie chart with the least radius
    product3=np.array([7,4,4,8,9])
    #defining the size or the pie chart
    size=1
    #calling the nested_pie() function
    nested_pie(product1,product2,product3,size)
#declaring main () function as the main driving code of the program.
if __name__ == "__main__":
    main ()
Output:
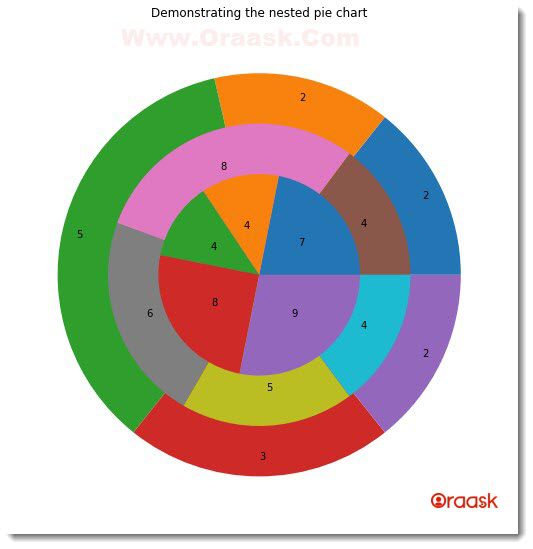
However, if we create data frames in pandas, we can call the label columns from the data frame using python’s iloc() function.
Example (6)
#import all the necessary libraries and modules
import matplotlib.pyplot as plt
import numpy as np
import pandas as pd
#creating a user-defined function named nested_pie()
def nested_pie(x1,x2,x3,size,df):
    #creating figure object
    fig=plt.figure(figsize=(5,10))
    #creating the axis with 4 parameters passed
    ax=fig.add_axes([0,0,1,1])
    #creating the outermost pie chart
    ax.pie(x1,radius=size,labels=df.iloc[0:3,1],labeldistance=0.9)
    #creating the middle pie chart
    ax.pie(x2,radius=size-0.3,labels=df.iloc[0:3,1],labeldistance=0.6)
    # ax.pie(x3,radius=size-0.6)
    ax.pie(x3,radius=size-0.6,labels=df.iloc[0:3,1],labeldistance=0.3)
    #creating the title of the chart.
    plt.title("Demonstrating the nested pie chart using data frame")

def main():
    marks_of_students={'students':['jakson','richard','bobin',"tesla"],
    'mathematics':[78,86,79,89],
    'science':[72,86,79,76],
    'history':[89,97,95,78]}
    df=pd.DataFrame(marks_of_students,columns=['students','mathematics','science','history'])
    x1= df.iloc[0:3,1]
    x2= df.iloc[0:3,2]
    x3= df.iloc[0:3,3]
    size=1
    nested_pie(x1,x2,x3,size,df)
#declaring the main() function as the main driving code of the program.
if __name__ == "__main__":
    main ()
Output:
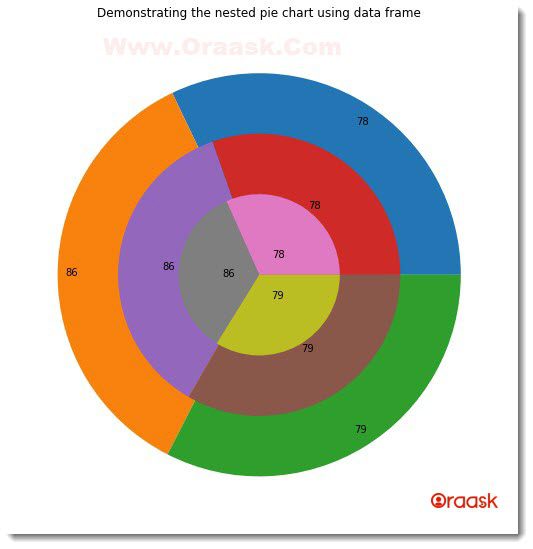
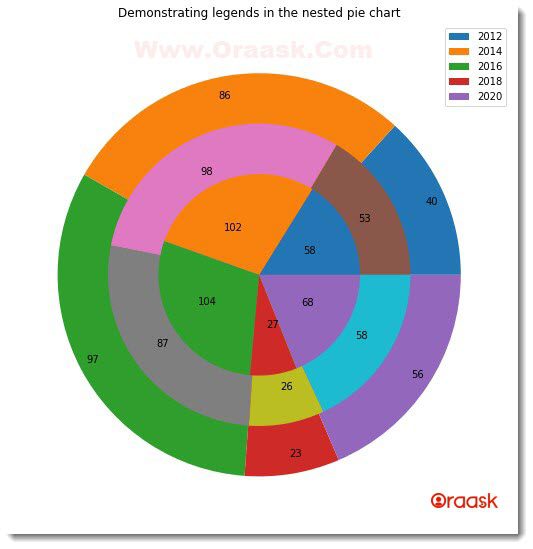
Adding Legend to Nested Pie Chart:
Another critical aspect of the nested pie chart is adding legends to the plot. Legends are small boxes on the figure that help identify multiple graphs or plots in the exact figure.
Example (7)
#import all the necessary libraries and modules
import matplotlib.pyplot as plt
import numpy as np
#creating a user-defined function named nested_pie()
def nested_pie(x,y,z,size):
    #creating figure object
    fig=plt.figure(figsize=(7,10))
    #creating the axis with 4 parameters passed
    ax=fig.add_axes([0,0,1,1])
    #creating the outermost pie chart
    ax.pie(x,radius=size,labels=x,labeldistance=0.9)
    #creating the middle pie chart
    ax.pie(y,radius=size-0.25,labels=y,labeldistance=0.75)
    #creating the smallest pie chart
    ax.pie(z,radius=size-0.5,labels=z,labeldistance=0.50)
    #Giving a title to the plot
    plt.legend(["2012","2014","2016","2018","2020"])
    plt.title("Demonstrating legends in the nested pie chart")
def main():
    #creating data point for the outermost pie chart
    product1=np.array([40,86,97,23,56])
    #creating data point for the middle pie chart
    product2=np.array([53,98,87,26,58])
    #creating data point for the pie chart with the least radius
    product3=np.array([58,102,104,27,68])
    #defining the size or the pie chart
    size=1
    #calling the nested_pie() function
    nested_pie(product1,product2,product3,size)
#declaring main () function as the main driving code of the program.
if __name__ == "__main__":
    main ()
Output:
Conclusion
This article taught us how to create a nested pie chart in matplotlib. We have also learned about many associated attributes and functions. We first created a simple nested chart. Then we learned how to add extra information to the plot using different attributes to make it more informative. We also learned how to plot the nested pie chart by creating data frames in the code.
Although we have learned about many aspects, it is recommended that the readers look up the python matplotlib documentation to have more ideas about the topic.


