How Can We Help?
Introduction
Legends are essential parts of the plot. Whenever we deal with multiple plots in the exact figure, we need to use the legend to make it easier to understand the plots. However, if the number of legends in the plot is relatively higher, then the legend might overflow with the plot, and hence we may need to keep the legend outside the plot. This article will explain how to put legends outside the plot.
[adinserter block=”1″]
Using The bbox_to_anchor=() Argument
One of the most convenient methods to set the legend outside the plot is to use the bbox_to_anchor=() function. The argument takes two parameters. They function as follows:
- If you set the first number to 0, the legend would be on the extreme left. But if you set it to 1, it would be on the extreme right.
- If you set the second number to 0, the legend box would be placed on the extreme bottom, and if you set it t to 1 would place on top.
How To Place Legend To The Upper Right Corner
We can use the appropriate value of the box_anchor parameter to place the legend tar the upper right corner. The upper right corner is a convenient location to place the legend outside the plot. We can use the value (1,1) to the argument to place the legend in the upper right corner.
Example (1)
[adinserter block=”2″]
# Import all the necessary libraries and packages in the code
import matplotlib.pyplot as plt
import numpy as np
# Create a user-defined function to plot the graph


def legend_outside(x):
    # Create the figure object
    fig = plt.figure(figsize=(9, 9))
    # Create the axes object
    ax = plt.subplot(111)
    # Iterating to plot the graph
    for i in range(5):
        ax.plot(x, i * x, label='$y = %ix$' % i)
    # Using the legend function to define the legend
    ax.legend(bbox_to_anchor=(1, 1))
    # show the figure object in the plot
    plt.show()
# Create the main function


def main():
    # Define the data points for the plot
    x = np.arange(10)
    # Call the legend_outside function to plot the graph
    legend_outside(x)


# Call the main function
if __name__ == "__main__":
    main()
Output:
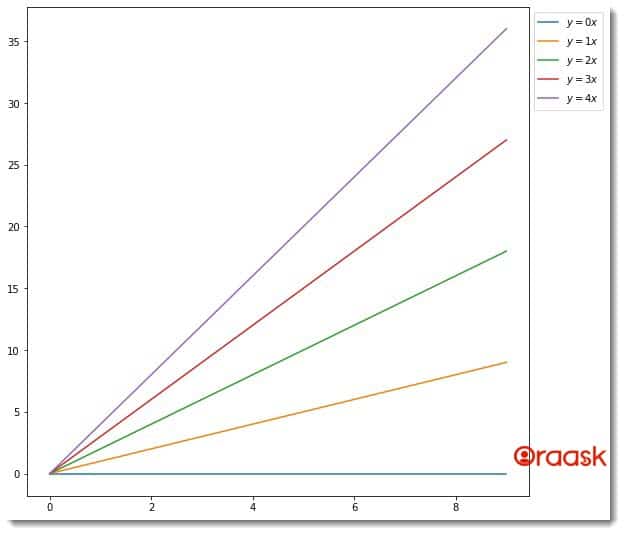
Explanation:
- First, we have imported all the necessary libraries and packages to run the program. Next, we have created a user-defined function named legend_outside. The function is void and takes only one argument, namely x. Under this function, we first used the figure function to define the figure object. We used the figsize attribute to define the size of the figure.
- Next, we created the axes object using the subplot function. Now we have used the plot function to plot the graph in the figure. By using the legend function, we have defined the legend position.
- After the legend_outside function, we created the main function. This is the main part of the program. Under this function, we have defined all the data points required to draw the figure. We used the arange function to create an array.
- We called the legend_outside function to plot the graph. Finally, we used the following lines of code and called the main program to execute our program: if __name__ == “main“: main()
[adinserter block=”3″]
How To Place The Legend To The Top Left Corner Of The Plot
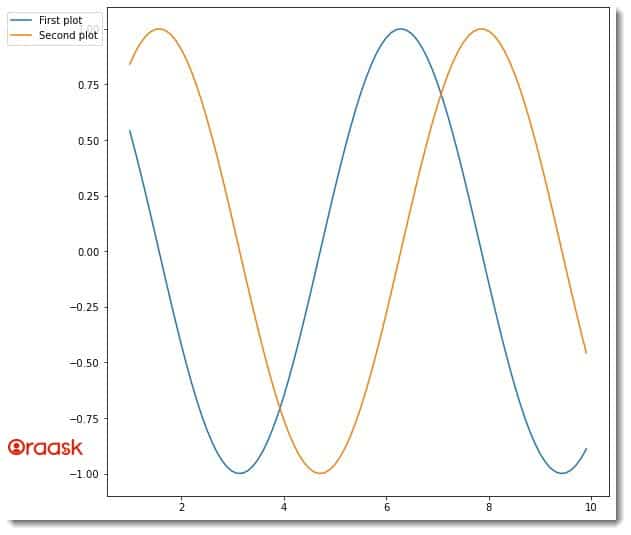
We can use the same function to place the legend at the top left corner outside the plot.
We only need to change the argument to get the desired result.
Example (2)
# Import all the necessary libraries and packages in the code
import matplotlib.pyplot as plt
import numpy as np
# Create a user-defined function to plot the graph

def legend_outside(x,y1,y2):
    # Create the figure object
    fig = plt.figure(figsize=(9, 9))
    # Create the axes object
    ax = plt.subplot(111)
    # Iterating to plot the graph
    ax.plot(x, y1, label="First plot")
    ax.plot(x, y2, label="Second plot")
    # Usuing the legend function to define the legend
    ax.legend(bbox_to_anchor=(0, 1))
    # show the figure object in the plot
    plt.show()
# Create the main function


def main():
    # Define the data points for the plot
    x =np.arange(1,10,0.1)
    y1=np.cos(x)
    y2=np.sin(x)
    # Call the legend_outside function to plot the graph
    legend_outside(x,y1,y2)


# Call the main function
if __name__ == "__main__":
    main()
Output:
[adinserter block=”4″]
How To Put The Legend To The Right Side Of The Plot
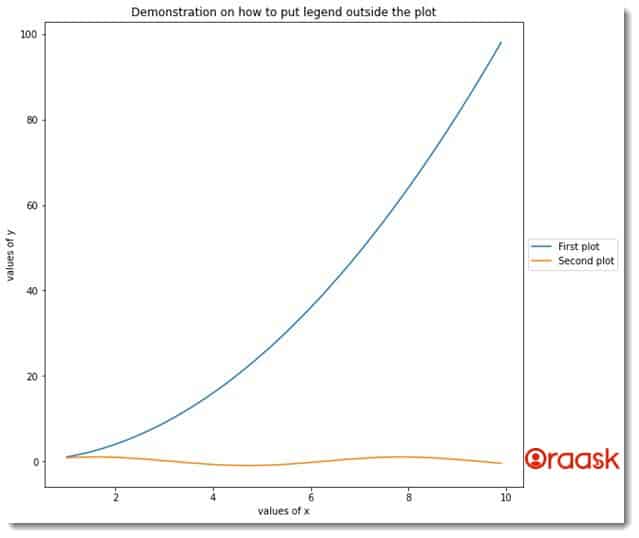
We can use the combination of the loc and the anchor property of the legend to place the legend on the right side of the plot. There is no unique way to achieve the same. One can use a combination of different logic to achieve the same. In this example, we will follow one such available method. Readers are encouraged to try finding any other method too.
Example (3)
# Import all the necessary libraries and packages in the code
import matplotlib.pyplot as plt
import numpy as np
# Create a user-defined function to plot the graph

def legend_outside(x,y1,y2):
    # Create the figure object
    fig = plt.figure(figsize=(9, 9))
    # Create the axes object
    ax = plt.subplot(111)
    # Iterating to plot the graph
    ax.plot(x, y1, label="First plot")
    ax.plot(x, y2, label="Second plot")
    # Using the legend function to define the legend
    plt.legend(loc='center left', bbox_to_anchor=(1, 0.5))
    # Define the title of the plot
    plt.title("Demonstration on how to put legend outside the plot")
    # Define the label of the plot along the x-axis
    plt.xlabel("values of x")
    # Define the labels of the plot along the y axis
    plt.ylabel("values of y")
    # show the figure object in the plot
    plt.show()
# Create the main function


def main():
    # Define the data points for the plot
    x =np.arange(1,10,0.1)
    y1=np.power(x,2)
    y2=np.sin(x)
    # Call the legend_outside function to plot the graph
    legend_outside(x,y1,y2)


# Call the main function
if __name__ == "__main__":
    main()
[adinserter block=”5″]
Output:
How To Put The Legend Above The Header
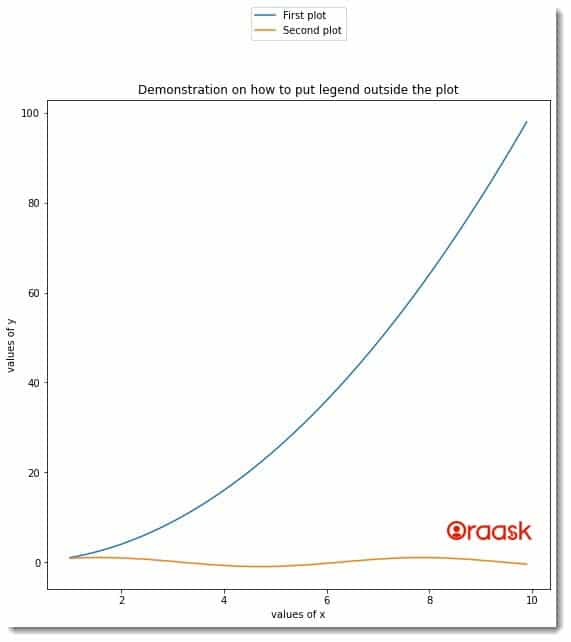
We can again use the combination of the loc and the anchor property to place the legend above the header section of the plot. We can adopt the following method to achieve the same:
First, use the loc property to put the legend at the top with justified alignment.
Now use the bbox_to_anchor property to shift the legend to the upper side of the title.
Example (4)
# Import all the necessary libraries and packages in the code
import matplotlib.pyplot as plt
import numpy as np
# Create a user-defined function to plot the graph

def legend_outside(x,y1,y2):
    # Create the figure object
    fig = plt.figure(figsize=(9, 9))
    # Create the axes object
    ax = plt.subplot(111)
    # Iterating to plot the graph
    ax.plot(x, y1, label="First plot")
    ax.plot(x, y2, label="Second plot")
    # Using the legend function to define the legend
    plt.legend(loc='upper center',bbox_to_anchor=(0.5, 1.2))
    # Define the title of the plot
    plt.title("Demonstration on how to put legend outside the plot")
    # Define the label of the plot along the x-axis
    plt.xlabel("values of x")
    # Define the labels of the plot along the y-axis
    plt.ylabel("values of y")
    # show the figure object in the plot
    plt.show()
# Create the main function


def main():
    # Define the data points for the plot
    x =np.arange(1,10,0.1)
    y1=np.power(x,2)
    y2=np.sin(x)
    # Call the legend_outside function to plot the graph
    legend_outside(x,y1,y2)


# Call the main function
if __name__ == "__main__":
    main()
Output:
[adinserter block=”6″]
In the above code, we first used the loc argument to place the legend at the top of the plot(but inside it). Next, we used the box_anchor function to shift the location of the legend. Shifting the value of the second position only changes the location along the y-axis. If you change the value of the first parameter, then it will shift along the x-axis.
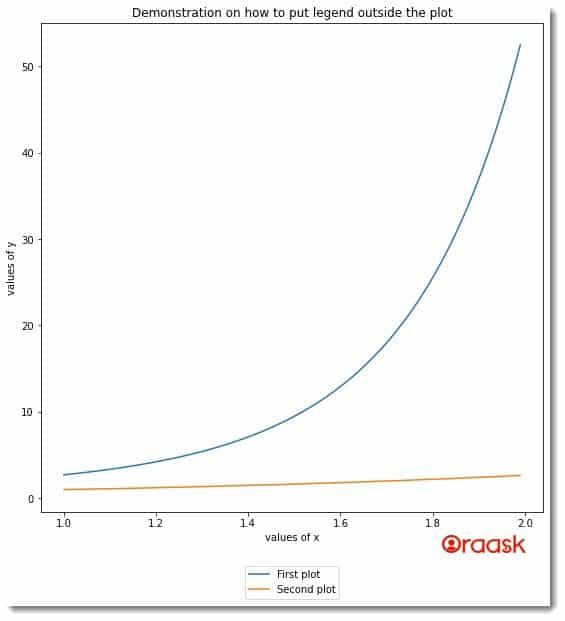
How To Place The Legend Below The Plot
Like the previous example, we can use the loc property and the bbox_to_anchor argument to place the legend below the plot.
The below code shows the implementation of this approach:
[adinserter block=”7″]
Example (5)
# Import all the necessary libraries and packages in the code
import matplotlib.pyplot as plt
import numpy as np
# Create a user-defined function to plot the graph

def legend_outside(x,y1,y2):
    # Create the figure object
    fig = plt.figure(figsize=(9, 9))
    # Create the axes object
    ax = plt.subplot(111)
    # Iterating to plot the graph
    ax.plot(x, y1, label="First plot")
    ax.plot(x, y2, label="Second plot")
    # Using the legend function to define the legend
    plt.legend(loc='upper center',bbox_to_anchor=(0.5,-0.1))
    # Define the title of the plot
    plt.title("Demonstration on how to put legend outside the plot")
    plt.title(loc='upper center',bbox_to_anchor=()
    # Define the label of the plot along the x-axis
    plt.xlabel("values of x")
    # Define the label of the plot along the y axis
    plt.ylabel("values of y")
    # show the figure object in the plot
    plt.show()
# Create the main function


def main():
    # Define the data points for the plot
    x =np.arange(1,2,0.01)
    y1=np.exp(np.power(x,2))
    y2=np.power(x,np.power(x,1/2))
    # Call the legend_outside function to plot the graph
    legend_outside(x,y1,y2)


# Call the main function
if __name__ == "__main__":
    main()
Output:
[adinserter block=”8″]
Final Words
In this article, we have understood how to place the legend outside the plot. We saw the usage of the loc and the box_anchor arguments. Along with it, we also saw the usage of a few other parameters and functions associated with the plot. We strongly recommend that readers try placing the legend in different positions concerning the plot to understand the topic more.


