How Can We Help?
Introduction
The legend is one of the plot’s most essential and valuable components. We use matplotlib to specify different parts of the plot. However, sometimes we do not need to use the matplotlib legends, and we may need to remove them.
This article will explain how to remove legends from the plot.
Not Defining The Legend
The best way to remove the legend is by not using it! In matplotlib, we have to define the legends separately to make the legend in the plot. However, if we want to delete it, it is a good idea not to define it.
Example (1)
[adinserter block=”1″]
# Import all the necessary libraries and packages in the code
import matplotlib.pyplot as plt
import numpy as np
# Define the scatter_plot function


def line_plot(n, y, z):
    # Define the size of the scatter plot
    fig = plt.figure(figsize=(9, 9))
    # Creating the axes object
    ax = plt.axes()
    # Plotting the scatter plot
    ax.plot(y, z)
    # Defining the label along the x-axis
    plt.xlabel("X coordinates")
    # Defining the label along the y-axis
    plt.ylabel("Y coordinates")
    # Defining the title of the plot
    plt.title("Scatter plot labelling")
    # Displaying the plot
    plt.show()
# Defining the main function


def main():
    # Creating the data points
    y = np.arange(1, 10, 1)
    z = np.power(y, 2)
    # Making pairs from the elements from y and z.
    n = zip(y, z)
    # Calling the scatter_plot function
    line_plot(n, y, z)


# Calling the main function
if __name__ == "__main__":
    main()
Output:
[adinserter block=”2″]
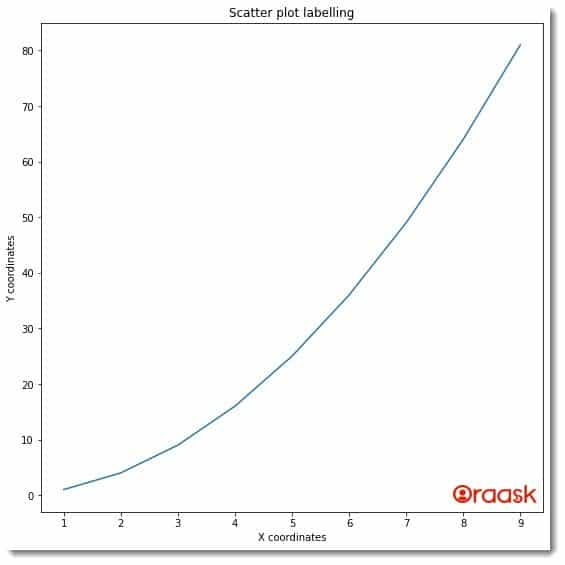
As we can see in the above plot, we do not have the legend since we never defined the legend in the plot.
Sometimes the programmers work with so many plots at once that it may become difficult to manually and delta the legends. Programmers may also need to use the legend at some later point in time. In such situations, the programmer first defines the legends in the plot and later uses many functions to either hide or remove the legends.
The following few sections describe the same procedure.
Using get_legend().remove() Method
The get_legend().remove() method is a popular technique to remove the legend from the plot. The function works on one axes object at a time and deletes its legend from the plot. If multiple axes exist, then they will be unaffected.
Check This: There is a full guide on Matplotlib Legend if you want to know more about legends and how to use them.
Example (2)
# Import all the necessary libraries and packages in the code
import matplotlib.pyplot as plt
import numpy as np
# Define the scatter_plot function


def line_plot(y, z):
    # Define the size of the scatter plot
    fig, ax = plt.subplots(2, 1,figsize=(9,9))
    # Plotting the scatter plot
    ax[0].plot(y, z)
    ax[1].plot(y, z)
    # Defining the label along the x-axis
    ax[0].set_xlabel("X coordinates")
    ax[1].set_xlabel("X coordinates")
    # Defining the label along the y-axis
    ax[0].set_ylabel("Y coordinates")
    ax[1].set_ylabel("Y coordinates")
    # Defining the title of the plot
    ax[0].set_title("Line plot labelling")
    # Defining the legend
    ax[0].legend("This is the legend")
    ax[1].legend("This is the legend")
    # Removing the legend
    ax[1].get_legend().remove()
    # Displaying the plot
    plt.show()
# Defining the main function


def main():
    # Creating the data points
    y = np.arange(1, 10, 1)
    z = np.power(y, 2)
    # Calling the scatter_plot function
    line_plot(y, z)


# Calling the main function
if __name__ == "__main__":
    main()
[adinserter block=”3″]
Output:
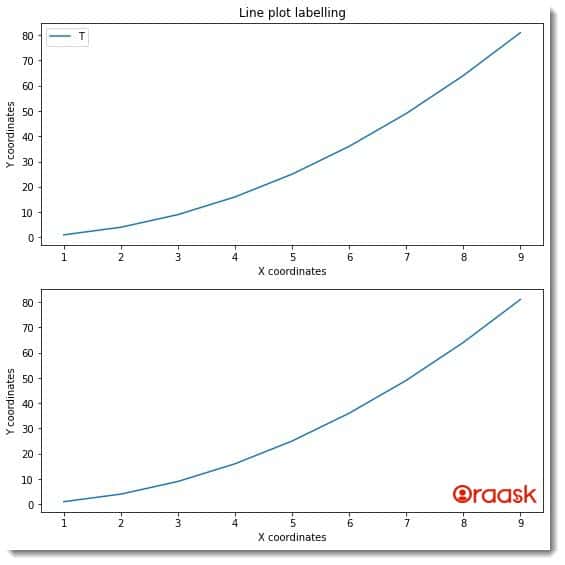
Explanation:
- First, we have defined all packages and codes in our code using the import statement of python. We imported the pyplot module and the numpy library in our code.
- Next, we have created a custom-defined function named line_plot. The function is a void function that takes two parameters, y, and z.
- Next, under the function, we have defined the figure, and the axes object using the subplots function. We defined the size of the plot using the figsize attribute of the function. We have passed argument 2,1 to the subplots function, which defines that we have two rows and only one column in the plot.
- Next, we used the axes object’s plot function to plot the figure’s data points. We also used the xlabel and the ylabel functions to define the labels along the axes of the figure. We used the legend function to define the legend of the plots. Next, we used the get_legend().remove() function for the second plot to remove the legend.
- Notice that although both the subplots are essentially the same, they differ because the second subplot does not have the legend.
- Next, we used the show function to display the plot. Note that in Jupyer Notebook, we do not need to use the function.
- After the line_plot function, we created the main function, which is the deriving code of the program. Under this function, we created all the plot data points. We used the arange function of the numpy library to create a data point. We also used the power function to get the second-order power of the data points. The arange function takes three arguments, namely start, stop and step. The start parameter defines the start of the iteration, the stop defines the number up to which the iteration should run, and the step, as the name suggests, defines the iterating step of the iteration.
- We called the line_plot function to plot the graph.
- Finally, we called the main function with the help of the following lines of codes: if __name__ == “main“: main()
Using the set_visible Function
If we do not want to use the previous method and want only to keep the visibility of the legend to be False, then we need to use the set_visible attribute. The internal work of this function is different from the remove method we discussed above. This function only sets the visibility of the legend to False, whereas the previous one completely removes the legend.
Example (3)
[adinserter block=”4″]
# Import all the necessary libraries and packages in the code
import matplotlib.pyplot as plt
import numpy as np
# Define the scatter_plot function


def line_plot( y, z):
    # Define the size of the scatter plot
    fig, ax = plt.subplots(2, 1,figsize=(9,9))
    # Plotting the scatter plot
    ax[0].plot(y, z,color="red")
    ax[1].plot(y, z,color="red")
    # Defining the label along the x-axis
    ax[0].set_xlabel("X coordinates")
    ax[1].set_xlabel("X coordinates")
    # Defining the label along the y-axis
    ax[0].set_ylabel("Y coordinates")
    ax[1].set_ylabel("Y coordinates")
    # Defining the title of the plot
    ax[0].set_title("Line plot labelling")
    # Defining the legend
    ax[0].legend("This is the legend")
    ax[1].legend("This is the legend")
    # Removing the legend
    ax[1].legend().set_visible(False)
    # Displaying the plot
    plt.show()
# Defining the main function


def main():
    # Creating the data points
    y = np.arange(-10, 10, 1)
    z = np.power(y, 3)
    # Calling the scatter_plot function
    line_plot(y, z)


# Calling the main function
if __name__ == "__main__":
    main()
Output:
Explanation:
[adinserter block=”5″]
- We imported the pyplot module and the numpy library in our code using the import statement of python. We have used the aliasing names for convenience in writing the codes.
- Next, we created a user-defined function named line_plot. The function takes only two parameters, namely y and z. Under this function, we have first defined axes and the fig object using the subplots function. We also defined the size of the plot using the figsize attribute of the function.
- Next, we used the set_xlabel and set_ylabel functions to define the legends along the x and y axes of the plot. We also used the title function to define the title of the plot.\
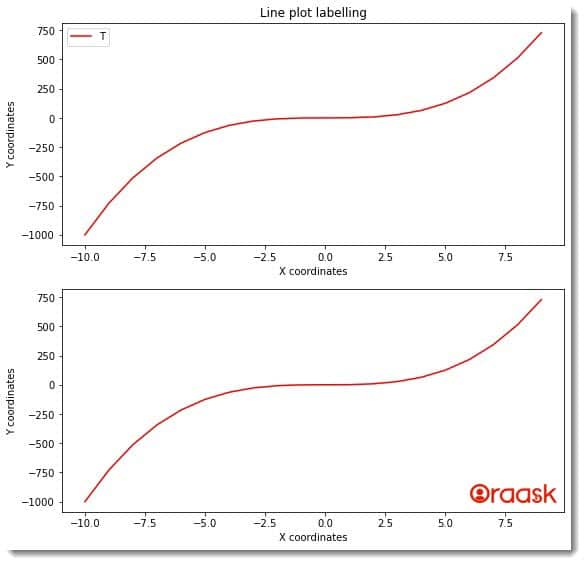
- Now we defined the legends of the plots. We have used the legend function to do so. To remove the legend from the second plot, we have used the following lines of codes:
- ax[1].legend().set_visible(False)
- Note that by default, the value of this function is set to True. The legend will be visible in the plot if you set the value to True or do not pass any value to this function.
- After the line_plot function, we used the main function, which is the driving code of the program. Under this function, we have used the arange and the power function to define the data points for the plot.
- Finally, we called the main function using the following lines of codes: if __name__ == “main“: main()
Using legend=None
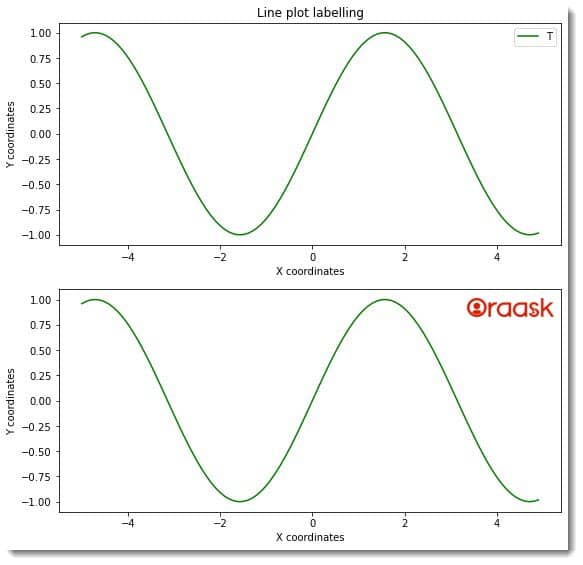
The method of using the technique legend =Nonte is very similar to the previous method we discussed. This method essentially sets the visibility of the legend to None in the plot.
Example (4)
# Import all the necessary libraries and packages in the code
import matplotlib.pyplot as plt
import numpy as np
# Define the scatter_plot function


def line_plot( y, z):
    # Define the size of the scatter plot
    fig, ax = plt.subplots(2, 1,figsize=(9,9))
    # Plotting the scatter plot
    ax[0].plot(y, z,color="green")
    ax[1].plot(y, z,color="green")
    # Defining the label along the x-axis
    ax[0].set_xlabel("X coordinates")
    ax[1].set_xlabel("X coordinates")
    # Defining the label along the y-axis
    ax[0].set_ylabel("Y coordinates")
    ax[1].set_ylabel("Y coordinates")
    # Defining the title of the plot
    ax[0].set_title("Line plot labelling")
    # Defining the legend
    ax[0].legend("This is the legend")
    ax[1].legend("This is the legend")
    # Removing the legend
    ax = plt.gca()
    ax.legend_ = None
    # Displaying the plot
    plt.show()
# Defining the main function


def main():
    # Creating the data points
    y = np.arange(-5, 5, 0.1)
    z = np.sin(y)
    # Calling the scatter_plot function
    line_plot(y, z)


# Calling the main function
if __name__ == "__main__":
    main()
[adinserter block=”6″]
Output:
Removing The Legend From The Three Dimensional Plot
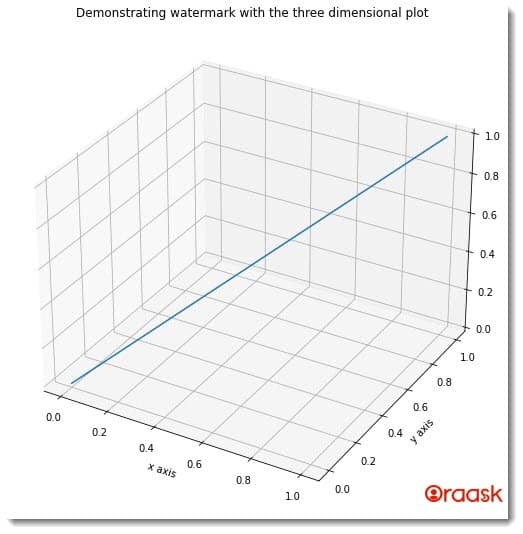
Removing the legend from the three-dimensional plot is equally easy. We can use all the methods and functions discussed previously with the three-dimensional plot. We are giving one such example here and encourage you to try other methods with the three-dimensional plot as an exercise.
Example (5)
# import all the necessary libraries and packages in our code
import matplotlib.pyplot as plt
import numpy as np
# Creating a user-defined function change_color


def watermark(z, x, y):
    # Creating the figure object
    plt.figure(figsize=(9, 9))
    # Creating the axes object
    ax = plt.axes(projection='3d')
    # Plotting the figure
    ax.plot3D(x, y, z)
    # Setting title of the plot
    ax.set_title(
        'Demonstrating how to hide legend with the three dimensional plot')
    # Defining the x label
    ax.set_xlabel('x axis')
    # Defining the y label
    ax.set_ylabel('y axis')
    ax.legend().set_visible(False)
    # Displaying the plot
    plt.show()
# Defining the main function


def main():
    z = np.linspace(0, 1, 10)
    x = np.linspace(0, 1, 10)
    y = np.linspace(0, 1, 10)
    # Calling the change_color function
    watermark(z, x, y)


# Calling the main function
if __name__ == "__main__":
    main()
[adinserter block=”7″]
Output:
Conclusion
In this article, we have learned how to remove the matplotlib legend in python matplotlib. We need to define the matplotlib separately. Hence instead of removing the legends, we should not define the legend beforehand if we want to remove it. We also learned about several other methods available, which let us remove the legends from the plot.
We strongly recommend that readers look up the python matplotlib documentation to understand the topic more.


