How Can We Help?
The two-dimensional figures have four axes. The two axes reside on the horizontal axis, and the other two reside on the vertical axis. Sometimes we may need to hide any of the axes in the plot. In this article, we will understand how to remove axis of the plot. We can remove single as well as multiple axes from the figure.
[adinserter block=”1″]
Prerequisite:
Before proceeding with the codes, you must ensure we have Numpy and matplotlib installed on your machine. If you are a windows user, type the following commands in PowerShell. And if you are a macOS user, type the same in the bash terminal. Hit enter after each step.
pip install matplotlib
pip install numpy
pip install seaborn
How to Remove axis in Matplotlib?
Removal of axes is the way of hiding the axes. Matplotlib allows us to do the same with the help of the following syntax:
[adinserter block=”2″]
Spines.<specific_position>.set_visible(False)If we want to hide the left axis, we need to change the specific_position by left; for the right axis, we need to change it to the right, etc.
Note that if we keep the value to True, it won’t make any changes, and the axes will be visible.
Example (1)
# Import the numpy and matplotlib library in the code
import numpy as np
import matplotlib.pyplot as plt
# Create a user-defined function called hide()
def hide(x, y):
    # Create a figure object
    fig = plt.figure(figsize=(9, 9))
    # Create an axes object
    ax = plt.axes()
    # Hiding the left axis
    ax.spines.left.set_visible(False)
# Creating a user-defined function called plot_figure()
def plot_figure(x, y):
    # Calling the hide() function
    hide(x, y)
    # Plotting the figure
    plt.plot(x, y, color="green")
    # Defining the label along the x-axis
    plt.xlabel("This is the x-label")
    # Defining the label along the y-axis
    plt.ylabel("This is the y-label")
    # Defining the title of the plot
    plt.title("Demonstrating how to hide axis in matplotlib")
    # Displaying the plot
    plt.show()
# Defining the main() function
def main():
    # Defining the data points
    x = np.linspace(0, 20, 100)
    y = np.sin(x)+np.cos(x)
    # Calling the plot_figure() function
    plot_figure(x, y)
# Calling the main() function
if __name__ == "__main__":
    main()
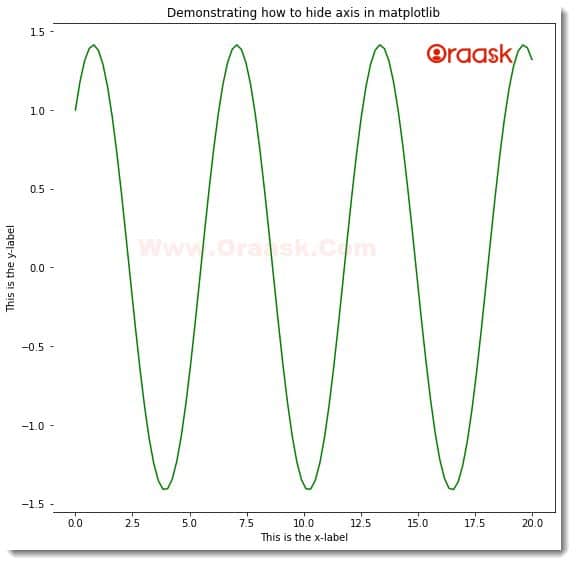
Output:
[adinserter block=”3″]
Explanation:
- First, we imported the libraries required to run the code. We imported the Numpy and matplotlib.pyplot using the import statement of python.
- Next, we created the hide() function. The function is a void function, and it takes parameters. Under this function, we first created the figure object using the figure() function. We set the size of the figure using the figsize attribute of the function. Next, we created the axes object using the axis() function. We used the following lines of codes to hide the left axis:
- ax.spines.left.set_visible(False)
- After the hide() function we created another user-defined function named plot_figure(). The function takes two positional arguments, namely x and y. Under this function, we first called the hide() function. The hide function is responsible for hiding the axis. After that, we plotted the graph using the plot() function. We passed x and y as the parameters and set the color of the plot to green using the color argument. We set the labels along the axis using the xlabel() and ylabel() functions. We used the title() function to set the title of the plot and the show() function to display the plot. Note that the show() function is optional in Jupyter Notebook. However, we strongly recommend the readers use this function.
- Next, we called the main() function. This is the driving code of the program. The interpreter first executes this part of the code in the program. Under this function, we created the data points for the x and the y axis using the numpy library. We called the plot_figure() function to plot the graph.
- Finally, we called the main() function using the following lines of codes:
if __name__ == “__main__”:
main()
Check This: if you are interested in checking How to How to Change x-axis and y-axis Limits in Matplotlib.
[adinserter block=”4″]
Hiding Multiple axes in Matplotlib:
This is also possible to hide multiple axes in the plot. We need to specify the function to hide the axes multiple times in the code. We need to specify which axes we want to hide.
Example (2)
# Import the numpy and matplotlib library in the code
import numpy as np
import matplotlib.pyplot as plt
# Create a user-defined function called hide()
def hide():
    # Create a figure object
    fig = plt.figure(figsize=(9, 9))
    # Create an axes object
    ax = plt.axes()
    # Hiding the left axis
    ax.spines.top.set_visible(False)
    ax.spines.right.set_visible(False)
# Creating a user-defined function called plot_figure()
def plot_figure(x, y):
    # Calling the hide() function
    hide()
    # Plotting the figure
    plt.bar(x, y, color="orange",width=2)
    # Defining the label along the x-axis
    plt.xlabel("This is the x-label")
    # Defining the label along the y-axis
    plt.ylabel("This is the y-label")
    # Defining the title of the plot
    plt.title("Demonstrating how to hide axis in matplotlib")
    # Displaying the plot
    plt.show()
# Defining the main() function
def main():
    # Defining the data points
    x = np.linspace(0, 20, 10)
    y = np.array([37,47,54,24,39,43,56,37,55,34])
    # Calling the plot_figure() function
    plot_figure(x, y)
# Calling the main() function
if __name__ == "__main__":
    main()
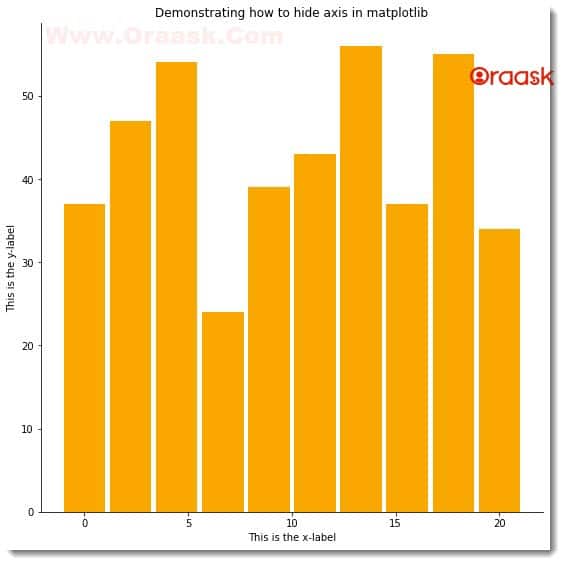
Output:
[adinserter block=”5″]
Explanation:
[adinserter block=”6″]
- We imported the Numpy library and the matplotlib.pyplot module. Note that we could have also imported the libraries at the last of the program. But importing the libraries at the top of the code is customary.
- Next, we created a user-defined void function named hide. The function does not take any parameter. Under this function, we first created the figure object. We specified the size of the figure using the figsize attribute. Next, we created the axes object using the axes() function. We used the following two lines of codes to hide the top and the right axes of the plot:
ax.spines.top.set_visible(False)
ax.spines.right.set_visible(False)
- After the hide() function we created the plot_figure() function. The function is also void but takes two positional arguments, namely x and y. Under this function, we called the hide() function to hide the right and the top axis from the figure. We used the bar() function to plot the bar graph. We specified color and width attributes to change the bars’ color and width, respectively.
- Using the xlabel() and ylabel() functions, we created the labels along the axes, and using the title function; we defined the title of the figure. We displayed the figure using the plt.show() function.
- Next, we created the main() function. We created the data points in the code using the Numpy array. After that, we called the plot_figure() function.
- We declared the main() function as the driving function of the code using the following lines:
if __name__ == “__main__”:
main()
Instead of calling only the set_visible() function, we can also call the set function only, which will produce the similar output:
[adinserter block=”7″]
Example (3)
# Import the numpy and matplotlib library in the code
import numpy as np
import matplotlib.pyplot as plt
# Create a user-defined function called hide()
def hide():
    # Create a figure object
    fig = plt.figure(figsize=(9, 9))
    # Create an axes object
    ax = plt.axes()
    # Hiding the left axis
    ax.spines.top.set(visible=False)
    ax.spines.right.set(visible=False)
    ax.spines.left.set(visible=False)
    ax.spines.bottom.set(visible=False)
# Creating a user-defined function called plot_figure()
def plot_figure(x, y):
    # Calling the hide() function
    hide()
    # Plotting the figure
    plt.scatter(x, y, color="purple")
    # Defining the label along the x-axis
    plt.xlabel("This is the x-label")
    # Defining the label along the y-axis
    plt.ylabel("This is the y-label")
    # Defining the title of the plot
    plt.title("Demonstrating how to hide axis in matplotlib")
    # Displaying the plot
    plt.show()
# Defining the main() function
def main():
    # Defining the data points
    x = np.random.randint(0, 20, 100)
    y = np.random.randint(0, 20, 100)
    # Calling the plot_figure() function
    plot_figure(x, y)
# Calling the main() function
if __name__ == "__main__":
    main()
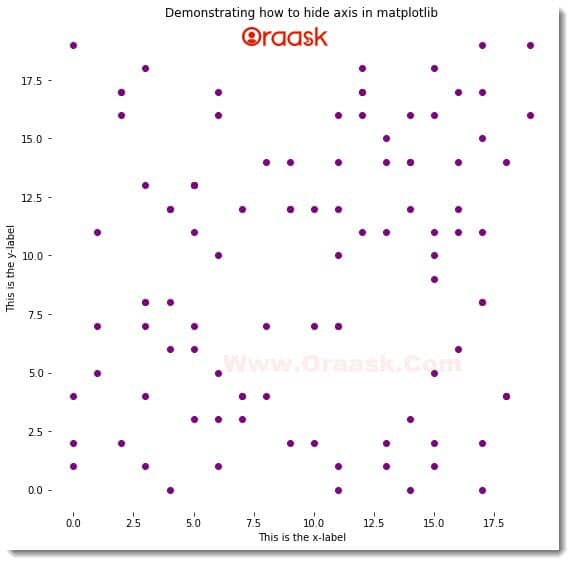
Output:
Using the Matplotlib Library:
[adinserter block=”8″]
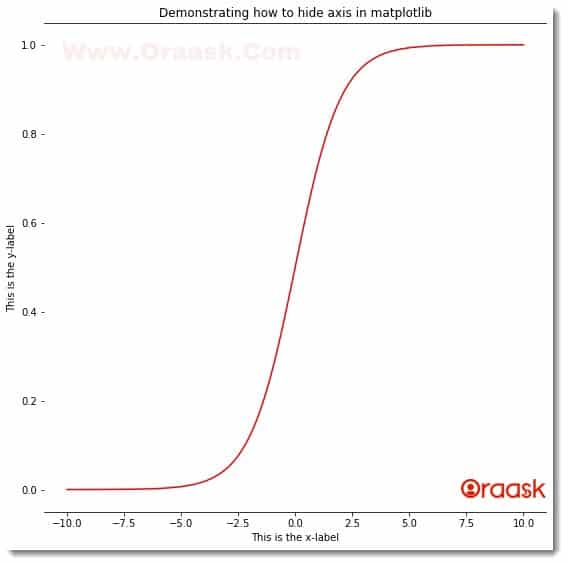
The matplotlib library itself contains functions to hide the axes. One such option is the use of the following syntax:
mpl.rcParams['axes.spines.<position>'] = FalseThe function can also be used to hide multiple axes in the plot. In the above syntax, matplotlib is imported as mpl as with alias name.
Example (4)
# Import the numpy and matplotlib library in the code
import numpy as np
import matplotlib.pyplot as plt
import matplotlib as mpl
# Create a user-defined function called hide()
def hide():
    # Create a figure object
    fig = plt.figure(figsize=(9, 9))
    # Create an axes object
    ax = plt.axes()
    # Set which axis to hide
    mpl.rcParams['axes.spines.left'] = False
    mpl.rcParams['axes.spines.right'] = False
    mpl.rcParams['axes.spines.top'] = True
    mpl.rcParams['axes.spines.bottom'] = True
# Creating a user-defined function called plot_figure()
def plot_figure(x, y):
    # Calling the hide() function
    hide()
    # Plotting the figure
    plt.plot(x, y, color="red")
    # Defining the label along the x-axis
    plt.xlabel("This is the x-label")
    # Defining the label along the y-axis
    plt.ylabel("This is the y-label")
    # Defining the title of the plot
    plt.title("Demonstrating how to hide axis in matplotlib")
    # Displaying the plot
    plt.show()
# Defining the main() function
def main():
    # Defining the data points
    x = np.linspace(-10, 10, 100)
    y = 1/(1 + np.exp(-1*x))
    # Calling the plot_figure() function
    plot_figure(x, y)
# Calling the main() function
if __name__ == "__main__":
    main()
Output:
[adinserter block=”9″]
Using the Combination of other Libraries to Remove Axes:
Python is so flexible that it gives us the flexibility to use multiple libraries in the same plot. For removing the axes, we can use the combination of the matplotlib and the seaborn library of python.
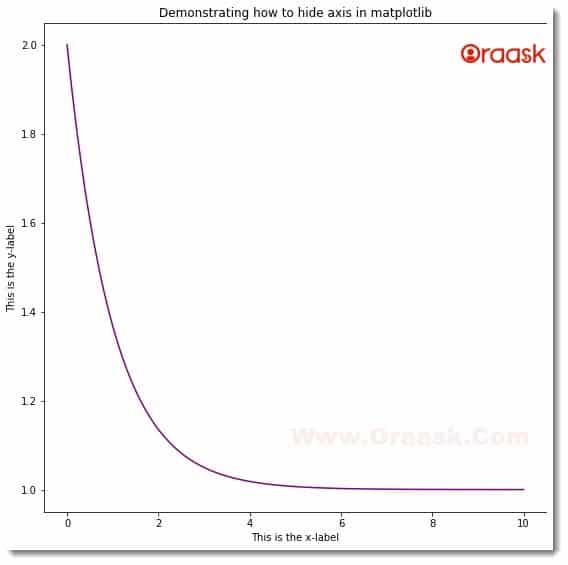
The despine() function is used to set the visibility of the axes. However, here the way of taking the argument is different. If we set the argument’s value to True, the axis will be hidden, and if set to False, the axis will be visible.
Example (5)
# Import the numpy and matplotlib library in the code
import numpy as np
import matplotlib.pyplot as plt
import seaborn as sns
# Create a user-defined function called hide()
def hide():
    # Create a figure object
    fig = plt.figure(figsize=(9, 9))
    # Create an axes object
    ax = plt.axes()
    sns.despine()
    # Set which axis to hide
    sns.despine(top=False, right=True, left=False, bottom=False)
# Creating a user-defined function called plot_figure()
def plot_figure(x, y):
    # Calling the hide() function
    hide()
    # Plotting the figure
    plt.plot(x, y, color="purple")
    # Defining the label along the x-axis
    plt.xlabel("This is the x-label")
    # Defining the label along the y-axis
    plt.ylabel("This is the y-label")
    # Defining the title of the plot
    plt.title("Demonstrating how to hide axis in matplotlib")
    # Displaying the plot
    plt.show()
# Defining the main() function
def main():
    # Defining the data points
    x = np.linspace(0,10,100)
    y =1+ np.exp(-1*x)
    # Calling the plot_figure() function
    plot_figure(x, y)
# Calling the main() function
if __name__ == "__main__":
    main()
Output:
[adinserter block=”10″]
Final Words
In this article, we understood how to hide the axes from the plot. We used the ax.spines.<position>.set_visible(False) method to hide the axes. Although most of the time, programmers will not require to use this feature, sometimes this may be useful too. For example, if we want to shoo a graph that extends to infinity, we may choose to remove the right and the top axes.


