How Can We Help?
Introduction
The Jupyter Notebook is a popular open-source project. This allows the users to create, share and run documents containing live data, visualizations, plain texts, etc. Matplotlib, on the other hand, is a python library that allows users to create plots. This article will discuss how to use Matplotlib in Jupyter Notebook.
Why Should we Prefer Jupyter Notebook?
A natural question arises in the readers’ mind why we should use the Jupyter Notebook instead of other IDE and code editors like vs. code, pycharm, etc.? The answer to this question is straightforward. Because of the much more convenience the Jupyter Notebook provides while dealing with the library. As this library deals with plots, the programmers often need to re-run the code while, during the subsequent execution, the previous one is erased away. The process may become so much irritating. Jupyter Notebook solves this problem by showing the plot under your code(before the next cell). As a result, you can see the outputs of the previous codes.
How to install Matplotlib in Jupyter Notebook
Installation of Matplotlib is simple in Jupyter Notebook too. We can use the cells available in the Jupyter Notebook as the space to write our code and install the dependencies in our workspace.
Simply run the following command:
pip install matplotlibGetting Started With Jupyter Notebook
Using the Jupyter Notebook is nothing different than the convenient programs we use in our code. Just use the same lines of code you used to run the programs in other code editors, and Jupyter Notebook will provide the same output. You can keep the old cell while moving on to the next one for the same or for some other code to run within the same workspace. This gives you an extra advantage in viewing the previous codes.
Example (1)
# Import all the necessary libraries and packages in the code
import matplotlib.pyplot as plt
import numpy as np
# Define the scatter_plot function


def scatter_plot(x,y):
    # Define the size of the scatter plot
    fig = plt.figure(figsize=(9, 9))
    # Creating the axes object
    ax = plt.axes()
    # Plotting the scatter plot
    ax.scatter(x,y)
    # Defining the label along the x-axis
    ax.set_xlabel("X coordinates")
    # Defining the label along the y axis
    plt.ylabel("Y coordinates")
    # Defining the title of the plot
    plt.title("Scatter plot labelling")
    # Displaying the plot
    plt.show()
# Defining the main function


def main():
    # Creating the data points
    x = np.arange(1, 10, 1)
    y = np.power(x, 2)
    # Calling the scatter_plot function
    scatter_plot(x,y)


# Calling the main function
if __name__ == "__main__":
    main()
Output:
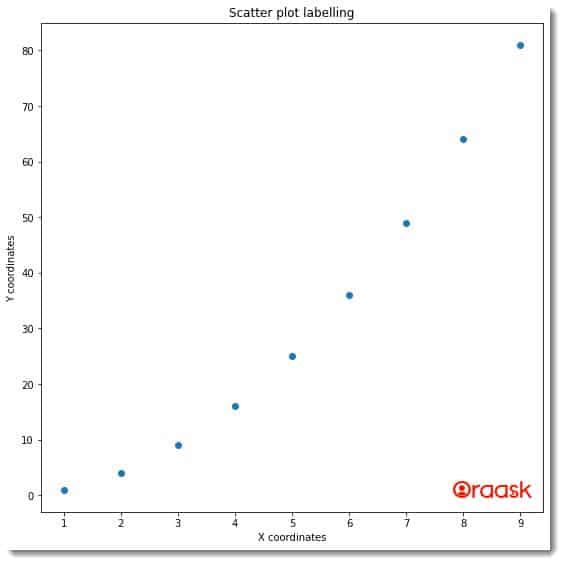
The below example illustrates another plot. The plot is three-dimensional (3D).
Example (2)
# importing numpy, and matplotlib
import numpy as np
import matplotlib.pyplot as plt

#creating a user-defined function line_2d()
def line_3d(x1,y1,z1,x2,y2,z2):
    #creating figure() object
    fig = plt.figure(figsize=(9,9))
    #creating axes() object
    ax = plt.axes(projection ='3d')
    #plotting the three-dimensional line plots
    ax.plot3D(x1, y1, z1, 'purple')
    ax.plot3D(x2, y2, z2, 'red')
    #defining the title of the plot
    ax.set_title('Three dimensional line plot using numpy and matplotlib')
    #displaying the plot
    plt.show()

#defining the main() function
def main():
    #creating the data points
    z1 = np.linspace(0, 10, 100)
    x1 =  np.power(z1,5)
    y1 = z1 * np.cos(z1)
    z2 = np.arange(0, 100, 1)
    x2 = z1 * np.sin(z2)*np.cos(z2)
    y2 = z1 * np.cos(z2)
    #calling the line_3d() function
    line_3d(x1,y1,z1,x2,y2,z2)

#calling the main() function
if __name__ == "__main__":
    main()
Output:
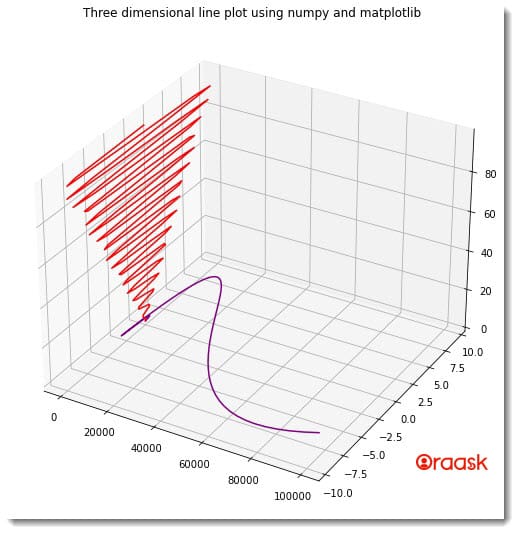
How To Plot From CSV Files In Jupyter Notebook
Jupyter Notebook is most popular in the domain of machine learning. So it is essential to understand how to read any CSV file and plot based on the dataset available.
Before proceeding with the code, follow the following steps:
- Open the folder where you want to code in Jupyter Notebook. You can do it by right-clicking on the folder and selecting -open with Jupyter Notebook.
- You will see the interface something like this:

- Next, click on the upload option available on the right side. You will see something like this:
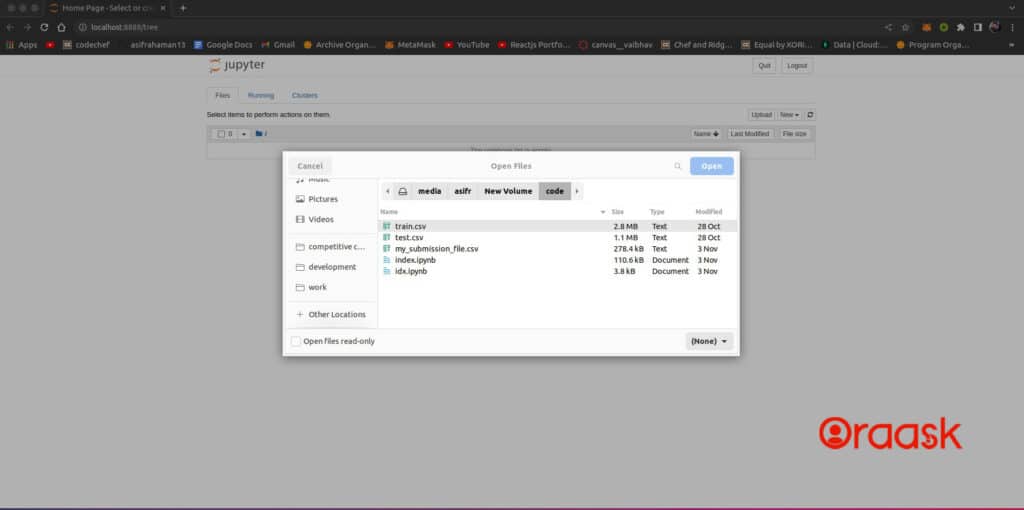
- Next, click on the upload option to see that your CSV file has been uploaded. Click on the new button to create a new python file for you. You can perform all your coding here.
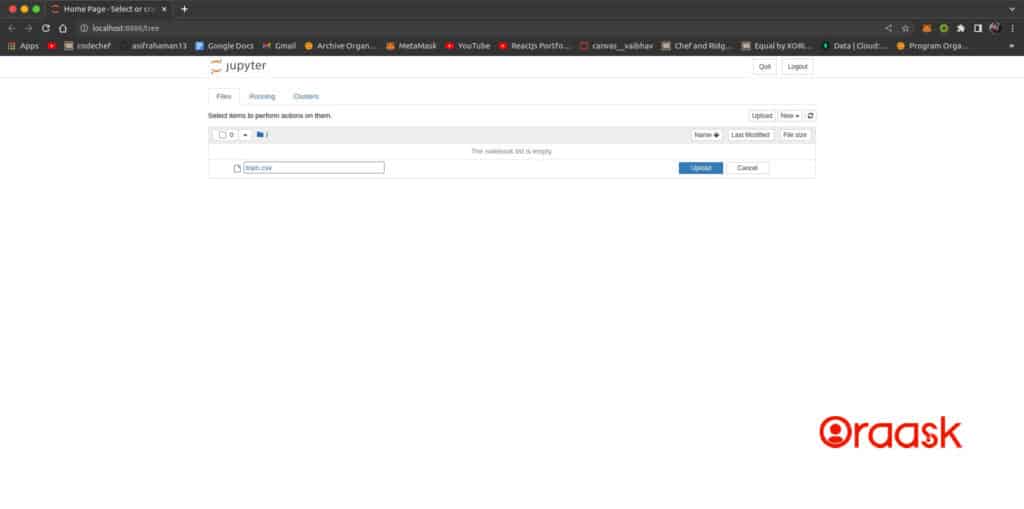
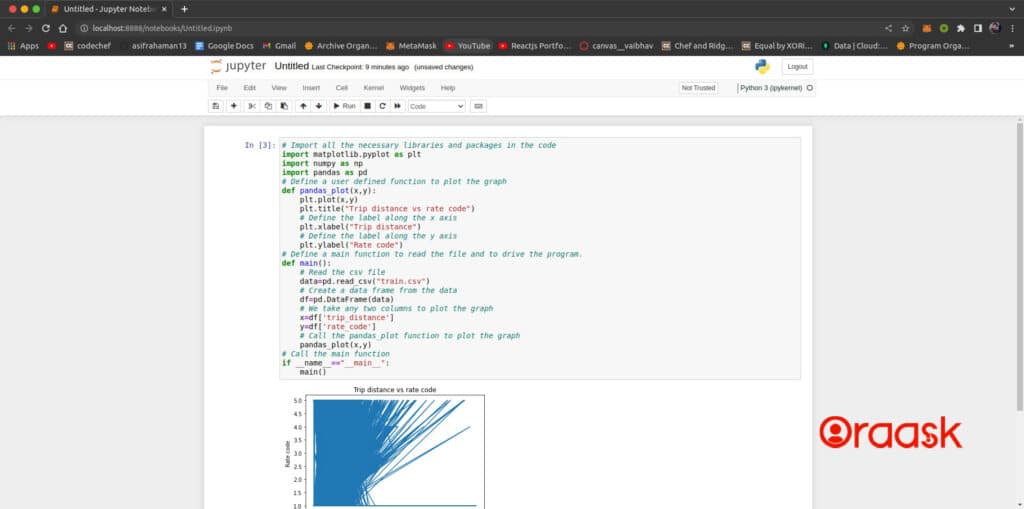
Now run the following lines of codes:
Example (3):
# Import all the necessary libraries and packages in the code
import matplotlib.pyplot as plt
import numpy as np
import pandas as pd
# Define a user-defined function to plot the graph
def pandas_plot(x,y):
    plt.plot(x,y)
    plt.title("Trip distance vs rate code")
    # Define the label along the x-axis
    plt.xlabel("Trip distance")
    # Define the label along the y axis
    plt.ylabel("Rate code")
# Define the main function to read the file and to drive the program.
def main():
    # Read the CSV file
    data=pd.read_csv("train.csv")
    # Create a data frame from the data
    df=pd.DataFrame(data)
    # We take any two columns to plot the graph
    x=df['trip_distance']
    y=df['rate_code']
    # Call the pandas_plot function to plot the graph
    pandas_plot(x,y)
# Call the main function
if __name__=="__main__":
    main()
Output:
Conclusion
In this article, we have seen how to use Matplotlib in Jupyter Notebook. We can use all the syntax we usually use in other code editors and IDEs. The only difference is that it has a different interface, and some extra functionalities are present in Jupyter Notebook.
We recommend that readers explore more about the Notebook from its official websites.


