How Can We Help?
In this article, we will learn about the legend() function, which is available in the matplotlib library of python. We know that Matplotlib is one of the most popular libraries available in python to visualize data. If we want to visualize the data, we can create 2D or even 3D graphs bills with the help of the matplotlib library in python.
We will focus on the legend() function of the matplotlib library; we will see the use cases of this function and how to use matplotlib legend.
What is a legend?
A Legend is an area of a graph describing each of the parts of that graph. So the legend is nothing but the part of the graph which explains each element of that graph. A lot of time graph can be self-explanatory but having a title in the graph labels on the axis and a legend that explains more about the graph. This section will learn how to insert a legend into the plot. Basically legend function can be in three forms.
- Legend without labels and handles
- Legend with labels only
- Legend with both labels and handles
Let us look at all three types of legends using examples.
Legend without Labels and Handles
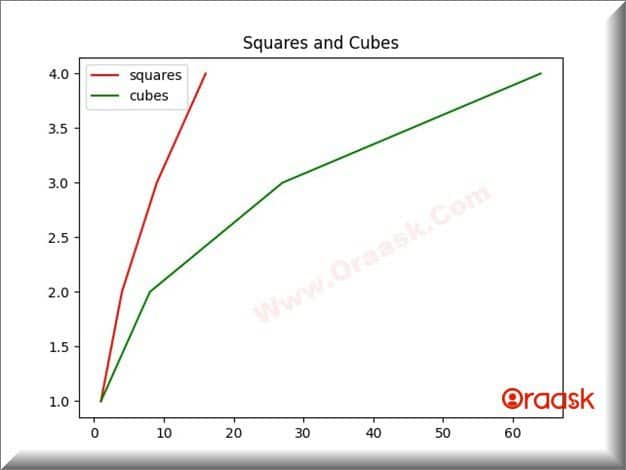
This is not mandatory that we have to pass parameters in the legend function. We can call legend without any parameter. But we need to consider that labels are defined already in the plot function; then, only the legend function will work. See the code below for a better understanding.
import numpy as np
import matplotlib.pyplot as plt
t = np.array([1,2,3,4])
plt.plot(t**2,t, color='red',label='squares')
plt.plot(t**3,t, color='green',label='cubes')
plt.title("Squares and Cubes")
plt.legend()
plt.show()
Output

Explanation
So if you don’t mention any argument in the legend function, it will automatically detect the labels from the plot function. So you must include labels in your plot function to get detected by the legend() function; if you don’t mention labels in the plot, the legend will not work.
The legend function displays all plots that have been labeled with keyword labels. The order of the lines in the legend is the same as the order you plot them.
Legend with Labels Only
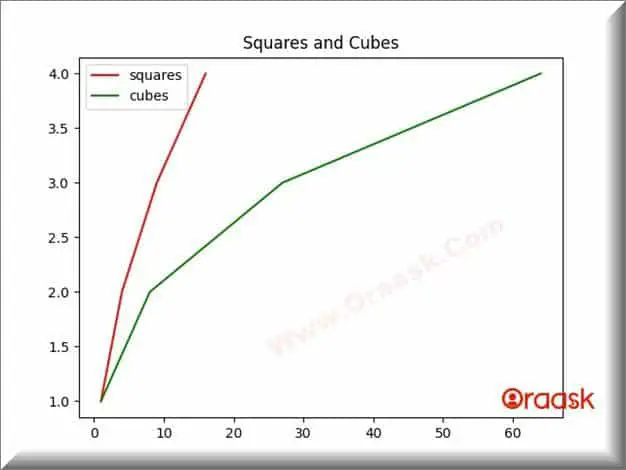
Suppose we don’t want to label our plot while plotting. We can ignore writing labels inside the plot function, and we can pass labels in the legend function respectively the plots are plotted. See the example below:
import numpy as np
import matplotlib.pyplot as plt
t = np.array([1,2,3,4])
plt.plot(t**2,t, color='red')
plt.plot(t**3,t, color='green')
plt.title("Squares and Cubes")
plt.legend([“squares”, “cubes”])
plt.show()
Output:

Note: Make sure this order is crucial while manually writing the labels inside the legend. You must have ordered your label as same as the plots are plotted.
Check This: Article on Change Legend Font Size, Name, Style, and Color if you want to know more about changing the legend font style with practical examples.
Legend with Labels and Handles
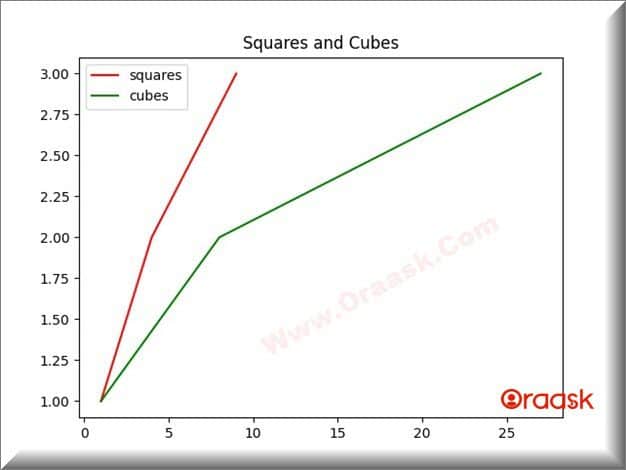
The plot function returns a list of a single item, and we can take that list in a variable; we can pass this variable to the legend function as a handle along with the corresponding label. See the code below for a better understanding:
import numpy as np
import matplotlib.pyplot as plt
t = np.array([1,2,3])
list1 = plt.plot(t**2,t, color='red')
list2 = plt.plot(t**3,t, color='green')
plt.title("Squares and Cubes")
plt.legend([list1, list2],["squares","cubes"])
plt.show()
Output:

Explanation:
The above code can be explained as follows:
- Here NumPy module is imported first. Another module, matplotlib, is also imported to plot the graphs.
- The variable t is defined, and a dataset is defined using the NumPy library.
- Now, two graphs called list1 and list2 are made to display the graph.
- Now plt. Legend () function is used to put the legends. The names of the graphs are given in the form of strings as arguments.
- Color is also defined to segregate the graphs in the plots.
- Finally, plt. show() is necessary to be called so that python displays the plot to the user.
Check This: Article on Removing the Legend from the plot in Matplotlib with practical examples.
Use the loc Keyword to Change the Legend Location.
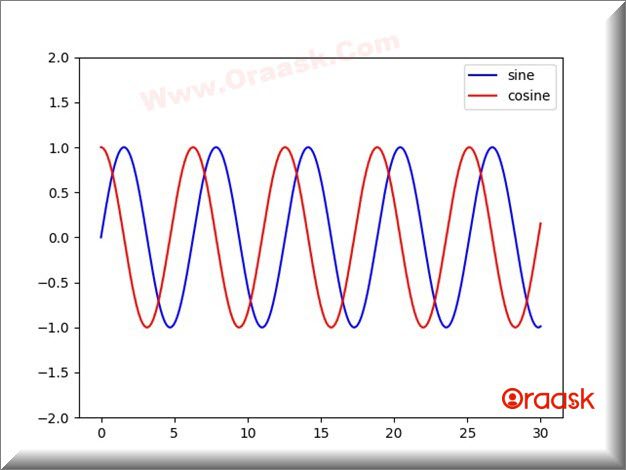
We can use the loc keyword inside the legend function to change the location of the legend on the graph. See the code below:
import NumPy as np
import matplotlib.pyplot as plt
x = np.linspace(0, 30, 1500)
y1 = np.sin(x)
y2 = np.cos(x)
plt.plot(x, y1, "-b", label="sine")
plt.plot(x, y2, "-r", label="cosine")
plt.legend(loc="upper right")
plt.ylim(-2.0, 2.0)
plt.show()
Output:

Explanation:
We used loc=” upper right” in the legend function in the code. So we are getting legend location at upper right. Similarly, we can use loc=” upper left”, loc=” lower left” and loc=” lower right” to get desired legend location.
Note:
- np.linespace() takes three parameters.The first parameter defines the starting of the numbers. The second parameter defines the ending point. The third parameter defines the number of points to be written.
- sin(x),cos(x) are built in functions to convert the array into sin and cosine functions.
- The location parameter under the legend gives the location where the legend needs to be displayed. By default, it is top right.
Other parameters that we can use are:
- upper left
- upper right
- lower left
- lower right
Conclusion
In this article, we have learned how to use matplotlib legend. These are different ways to use legend functions. Legends make the graph more informative and let the user know which graph is for which purpose within the plot.


