How Can We Help?
Scatter plots are defined as plots where dots or single points represent each value of the data points. These plots help determine the overall density of the points over the regions. Labeling the scattered points sometimes becomes essential to understand the graph better. Matplotlib allows us to annotate the scatter plot using several methods.
This article will discuss how to label each point in the scatter plot in Matplotlib.
Adding The Annotation Manually
The simplest way to add the annotation in the plot is to add them manually in the code using the annotate function. We first need to plot the scatter plot using the plot function. Later we need to use the annotate function to make the annotation in the plot.
[adinserter block=”1″]
Example (1)
# Import all the necessary libraries and packages in the code
import matplotlib.pyplot as plt
import numpy as np
# Define the scatter_plot function


def scatter_plot(n, y, z):
    # Define the size of the scatter plot
    fig = plt.figure(figsize=(9, 9))
    # Creating the axes object
    ax = plt.axes()
    # Plotting the scatter plot
    ax.scatter(y, z)
    # Creating the annotation manually
    ax.annotate(n[0], (y[0], z[0]), xytext=(y[0], z[0]))
    ax.annotate(n[1], (y[1], z[1]), xytext=(y[1], z[1]))
    ax.annotate(n[2], (y[2], z[2]), xytext=(y[2], z[2]))
    ax.annotate(n[3], (y[3], z[3]), xytext=(y[3], z[3]))
    ax.annotate(n[4], (y[4], z[4]), xytext=(y[4], z[4]))
    ax.annotate(n[5], (y[5], z[4]), xytext=(y[5], z[5]))
    ax.annotate(n[6], (y[6], z[4]), xytext=(y[6], z[6]))
    ax.annotate(n[7], (y[7], z[4]), xytext=(y[7], z[7]))
    ax.annotate(n[8], (y[8], z[4]), xytext=(y[8], z[8]))
    # Defining the label along the x-axis
    plt.xlabel("X coordinates")
    # Defining the label along the y-axis
    plt.ylabel("Y coordinates")
    # Defining the title of the plot
    plt.title("Scatter plot labelling")
    # Displaying the plot
    plt.show()
# Defining the main function


def main():
    # Creating the data points
    y = np.arange(1, 10, 1)
    z = np.power(y, 2)
    # Making pairs from the elements from y and z.
    n = zip(y, z)
    n=list(n)
    # Calling the scatter_plot function
    scatter_plot(n, y, z)


# Calling the main function
if __name__ == "__main__":
    main()
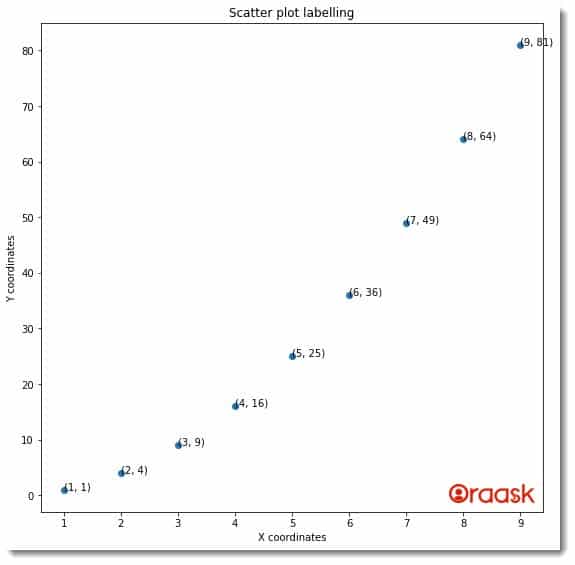
Output:

Explanation:
- First, we imported all the necessary libraries and packages in the code using the import statement of python. We imported the matplotlib and the numpy library in the code. We have used the aliasing technique for convenience in our code.
- Next, we defined a user-defined function named scatter_plot. This is a void function, and it takes three arguments, namely n,y, and z. Under this function, we first created the figure object using the figure function of matplotlib. We defined the size of the figure using the figsize attribute of python. We plotted the graph using the scatter function.
- Next, we used the annotate function to make the annotation. Under each annotated function, we passed three parameters. First is the text that needs to be displayed as the annotation. Second is the coordinates of the plot that we need to plot. And the third argument is the coordinate in which we should place the text.
- Next, we defined the labels along the x and y axes using the xlabel and ylabel functions. We also defined the title of the plot using the title function. Next, we displayed the graph using the show function.
- We created the main function, which is the driving code of our program. Under this function, we defined the data points for the plot. We used the arange function of numpy to create the data points. We made pair from y and z using the zip function. Then we converted the data type of the zip into a list using the list function. We called the scatter_plot function to plot the graph.
- Finally, we called the main function using the following lines of codes: if __name__ == “main“: main()
Check This: I have wrote a full guide on Matplotlib Scatter Plot if you want to know more about scatter plot in python matplotlib library (What it is and how to plot a scatter plot using different functions and techniques).
[adinserter block=”2″]
We can easily see that the above method is costly since we need to add the texts as annotations manually. We can omit the manual addition with the help of a loop. The below code will illustrate the same,
Example (2)
# Import all the necessary libraries and packages in the code
import matplotlib.pyplot as plt
import numpy as np
# Define the scatter_plot function


def scatter_plot(n, y, z):
    # Define the size of the scatter plot
    fig = plt.figure(figsize=(9, 9))
    # Creating the axes object
    ax = plt.axes()
    # Plotting the scatter plot
    ax.scatter(y, z)
    # Creating the annotation manually
    for i in range(len(n)):
        ax.annotate(n[i], (y[i], z[i]), xytext=(y[i]+0.2, z[i]+0.2))
    # Defining the label along the x-axis
    plt.xlabel("X coordinates")
    # Defining the label along the y-axis
    plt.ylabel("Y coordinates")
    # Defining the title of the plot
    plt.title("Scatter plot labelling")
    # Displaying the plot
    plt.show()
# Defining the main function


def main():
    # Creating the data points
    y = np.arange(1, 10, 1)
    z = np.power(y, 2)
    # Making pairs from the elements from y and z.
    n = zip(y, z)
    n = list(n)
    # Calling the scatter_plot function
    scatter_plot(n, y, z)


# Calling the main function
if __name__ == "__main__":
    main()
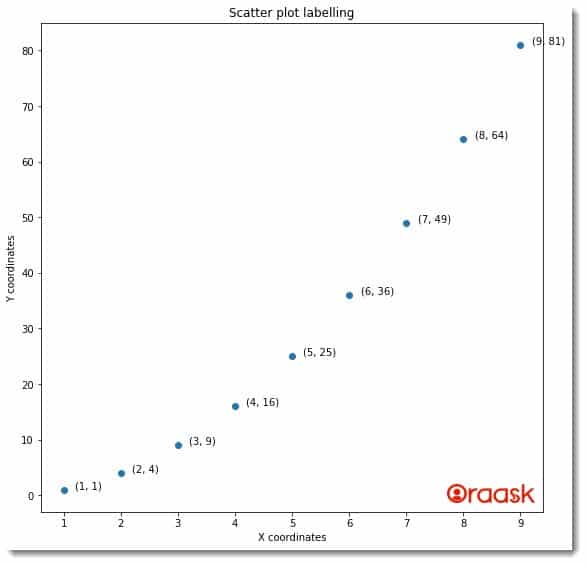
Output:

Notice that in the above function, instead of manually adding the data, we used the for loop to the code to automate the process. However still, if we want to place the texts in coordinates that are too specific, we will have to add them manually
Using The Enumerate and Zip Functions
We can use the combination of the enumerate and the zip function to define the annotation conveniently. The enumerate function keeps counting the iterating step during each iteration. On the other hand, the zip function helps to make a pair from two iterables.
Example (3)
# Import all the necessary libraries and packages in the code
import matplotlib.pyplot as plt
import numpy as np
# Define the scatter_plot function


def scatter_plot(n, y, z):
    # Define the size of the scatter plot
    fig = plt.figure(figsize=(9, 9))
    # Creating the axes object
    ax = plt.axes()
    # Plotting the scatter plot
    ax.scatter(y, z,color=’red’)
    # Iterating through the n variable and creating the annotation
    for i, txt in enumerate(n):
        ax.annotate(txt, (y[i], z[i]))
    # Defining the label along the x-axis
    plt.xlabel("X coordinates")
    # Defining the label along the y-axis
    plt.ylabel("Y coordinates")
    # Defining the title of the plot
    plt.title("Scatter plot labelling")
    # Displaying the plot
    plt.show()
# Defining the main function


def main():
    # Creating the data points
    y = np.arange(1, 10, 1)
    z = np.power(y, 2)
    # Making pairs from the elements from y and z.
    n = zip(y, z)
    # Calling the scatter_plot function
    scatter_plot(n, y, z)


# Calling the main function
if __name__ == "__main__":
    main()
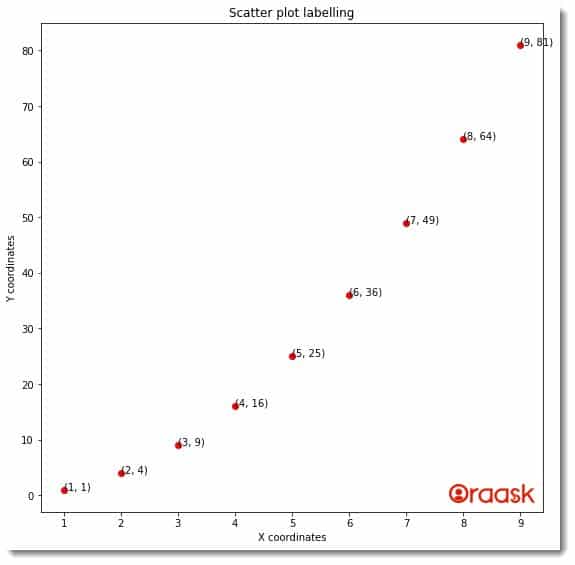
Output:
[adinserter block=”3″]

Explanation:
- We imported all the libraries and codes in our program at the top. Note that it is not required to import the libraries at the top. You are free to import them anywhere in the program.
- Next, we created a user-defined function called scatter_plot. This is a void function again, and it takes three parameters, namely x, y, and z. Under this function, we first defined the size of the figure using the figsize function.
- Next, we used the axes function of Matplotlib to create the axes object. We plotted the graph using the scatter function. Using the color function, we defined the color of the plot.
- After that, we iterated through the variable n and used the annotate function to make the annotation. We passed two parameters to the function. The first parameter is the text we need to display, and the second is the coordinate we need to plot.
- Next, we defined the labels along the axes using the xlabel and the ylabel function. We also defined the title of the function using the title function of matplotlib. After the scatter_plot function, we created the main function. Under the function, we created all the data points using the numpy library. We used the zip function to make pairs from the two variables. We called the scatter_plot function next to plot the graph.
- Finally, we called the main function using the following lines of codes: if __name__ == “main“: main()
Using Dictionaries In The Code
Many times we often get the data in the form of dictionaries. Dictionaries allow us to have the search operation in O(1) space complexity; hence, they are very efficient in the search algorithms. We can annotate the plots using the combination of previously discussed functions with a dictionary.
Example (4)
# Import all the necessary libraries and packages in the code.
import random
import matplotlib.pyplot as plt
import numpy as np
# Defining scatter_label function


def scatter_label(values, dictionary, words):
    # Iterating through the words variable
    for word in words:
        # Unpacking the x and the y coordinates.
        x, y = values[dictionary[word]]
        # Plotting the scatter plot
        plt.scatter(x, y, marker='+', color='green')
        # Defining the annotation
        plt.text(x+0.1, y+0.1, word, fontsize=15)
    # Defining the label along the x-axis
    plt.xlabel("X coordinates")
    # Defining the label along the y-axis
    plt.ylabel("Y coordinates")
    # Defining the title of the plot
    plt.title("Scatter plot labelling")
    # Displaying the plot
    plt.show()
# Defining the main function


def main():
    # Creating the figure object and defining the figure size.
    fig = plt.figure(figsize=(9, 9))
    # Defining the coordinates in the form of pairs
    values = np.array([[1, 1], [2, 2], [3, 3], [4, 4], [5, 5]])
    # Labelling the coordinates
    dictionary = {'co-ordinate1': 0, 'co-ordinate2': 1,
                  'co-ordinate3': 2, 'co-ordinate4': 3, 'co-ordinate5': 4}
    words = ['co-ordinate1', 'co-ordinate2',
             'co-ordinate3', 'co-ordinate4', 'co-ordinate5']
    # Calling the scatter_label function
    scatter_label(values, dictionary, words)


# Calling the main function
if __name__ == "__main__":
    main()
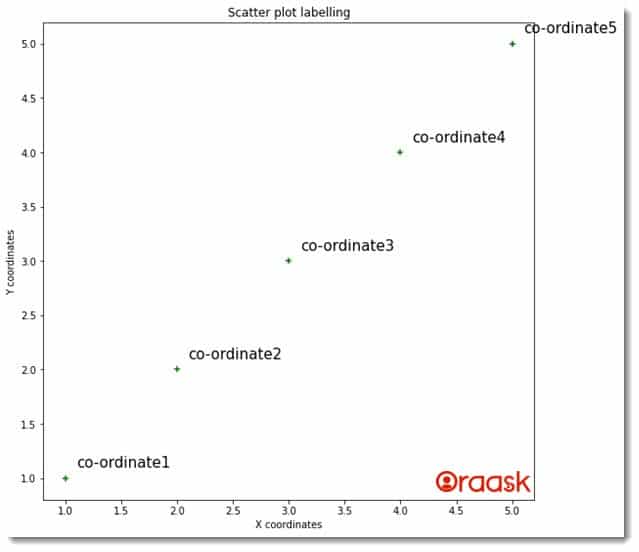
Output:

Explanation:
[adinserter block=”4″]
- We imported random and the numpy library in the code. We also imported the pyplot module.
- Next, we created a user-defined function named scatter_plot. This is a void function, and it takes three arguments, namely values, dictionaries, and words.
- Under this function, we iterated through the iterable ‘words’. Under each iteration, we unpacked the value of x and y using the indexing.
- We used the scatter function to plot the figure. Using the color attribute, we defined the color of the plot, and using the marker; we defined the marker style of the plot. After the plot, we also used the text function to add the annotation to the points. Next, we used the xlabel and the ylabel functions to define the labels.
- We also used the title function to define the title of the plot.
- After the scatter_label function, we defined the main function. This main function is the driving code of our program. Under the main function, we defined the figure size of the plot. Next, we created the data points for plotting the graph. We also created a dictionary using key-value pairs to define the coordinates.
- We called the scatter_label function with appropriate arguments to plot the graph.
- Finally, we called the main function using the following lines of codes: if __name__ == “main“: main()
Conclusion
In this article, we have understood how to add an annotation to all the points in matplotlib using different functions and techniques. We use the annotate function to make the annotation. But we need to use different techniques to display the texts in the figure.
We strongly recommend that the readers go through the python matplotlib official documentation to understand the topic more.
[adinserter block=”5″]


