How Can We Help?
Python is one of the most critical languages in the modern world. Being a clear language, it has libraries for almost all kinds of works to deal with. One of its libraries is matplotlib which is used to plot the graphs in 2 and 3 dimensions. It is also used to create animations etc.
What is Matplotlib Grid?
A grid is a geometry manager in the graph. It is used to put the graphs in the form of tables which are usually in two dimensions. It appears as if the graph is made up of many small elements called blocks or cells. It technically splits the entire graph in the form of rows and columns.
This article will learn about the different grids in python matplotlib and their associated attributes.
The basic plot of the grid can be demonstrated as follows:
Example (1)
import matplotlib.pyplot as plt
import numpy as np
x=np.arange(1,10,0.5)
y=np.tan(x)
plt.grid(visible=None, which='major', axis='both')
plt.xlabel("x values")
plt.ylabel("y value")
plt.legend(["tanx"])
plt.title("Demonstratinmg grid")
plt.show()
Output:
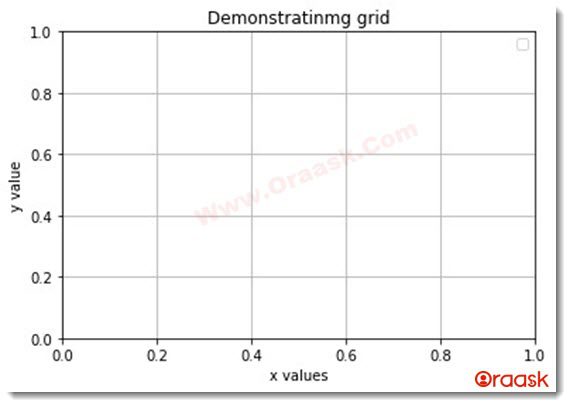
Explanation:
The above code can be explained as follows:
- First, we have imported the necessary package names called matplotlib and the numpy using their alias names plt and np. Note that we can use an alias name on our own.
- We then created the sequence of the data points for the “x” and the “y” axis. We used the numpy library for the same.
- Next, we used the grid function of matplotlib to plot the grid. We have also passed some more parameters like the visibility, axis, etc., to the function.
- Next we have put the x label, y label, legends and title to the graph using the functions xlabel(), ylabel(),legend(),title() functions respectively.
Displaying grid lines on only the x-axis
Sometimes we may want to display the grids only along the x-axis instead of both the axis. The lines will be vertical aligned. We can do this by passing an argument called axis to the grid() function.
Example (2)
import matplotlib.pyplot as plt
import numpy as np
x=np.arange(1,50,0.5)
y1=np.tan(x)
y2=np.cos(x)
y3=np.sin(x)
plt.grid(visible=True,axis="x")
plt.plot(x,y1,animated=True,color="purple")
plt.plot(x,y2,animated=True)
plt.plot(x,y3,animated=True,color="green")
plt.xlabel("x values")
plt.ylabel("y value")
plt.legend(["grid"])
plt.title("Demonstratinmg grid")
plt.show()
Output:
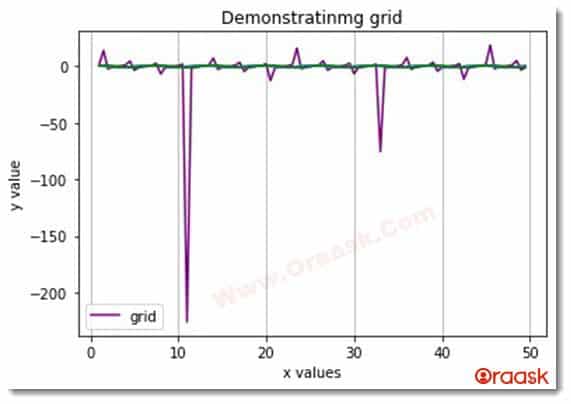
How to plot only grids on the y-axis?
We can also plot the grids along the y axis. Such grid lines are parallel to the x-axis. This can be done by specifying y as the value to the argument axis for the function grid().
Example (3)
import matplotlib.pyplot as plt
import numpy as np
x=np.arange(1,10,0.5)
y1=np.tan(x)
y2=np.cos(x)
y3=np.sin(x)
plt.grid(visible=True,axis="y")
plt.plot(x,y1,animated=True,color="purple")
plt.plot(x,y2,animated=True)
plt.plot(x,y3,animated=True,color="green")
plt.xlabel("x values")
plt.ylabel("y value")
plt.legend(["grid"])
plt.title("Demonstratinmg grid")
plt.show()
Output:
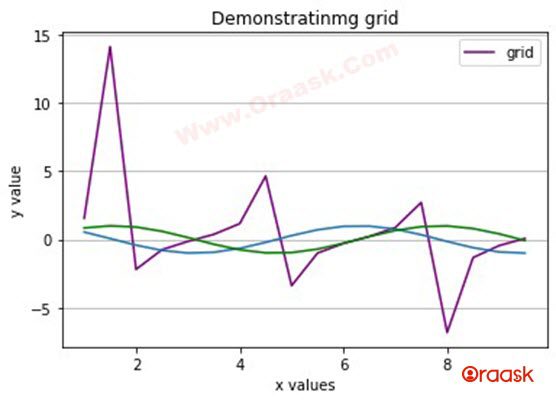
The grid function has a lot of parameters to offer. Let us discuss the same.
- Visible
- Color
- Alpha
1) visible:
This parameter defines whether The visible should show the grid lines in the plot. It is usually assumed that as the user wants the grid lines to be a part of the graph, he will most probably want them to be visible in the plot. Hence the default value is set to True. It can accept two parameters, which are either True or False. However, it can also take a third parameter called none.
Example (4)
import matplotlib.pyplot as plt
import numpy as np
x=np.arange(1,10,0.5)
y=np.tan(x)
plt.grid(visible=None, which='major', axis='both',color=’green’)
plt.xlabel("x values")
plt.ylabel("y value")
plt.legend(["tanx"])
plt.title("Demonstratinmg grid")
plt.show()
Output:
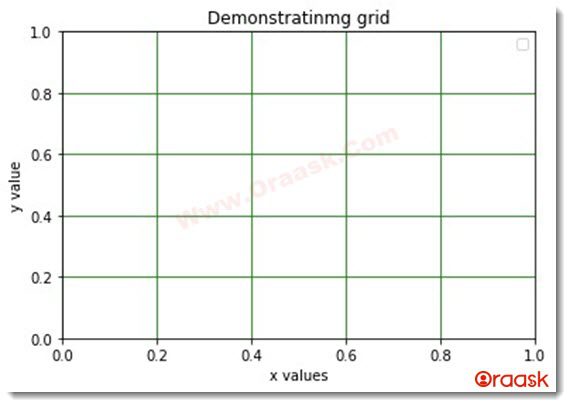
2) color:
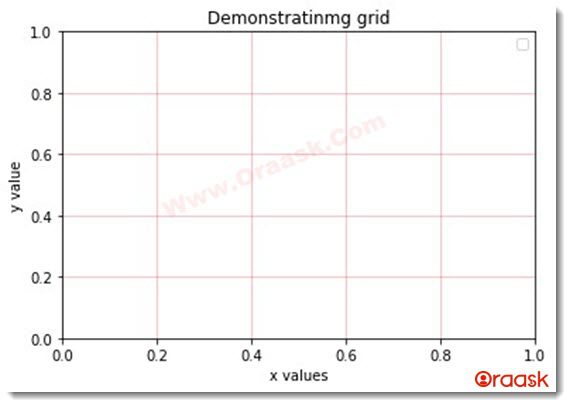
As the name suggests, the color attribute specifies the color of the grid lines.
Example (5)
import matplotlib.pyplot as plt
import numpy as np
x=np.arange(1,10,0.5)
y=np.tan(x)
plt.grid(visible=True,alpha=0.3,color="red")
plt.xlabel("x values")
plt.ylabel("y value")
plt.legend(["grid"])
plt.title("Demonstratinmg grid")
plt.show()
Output:
3) alpha:
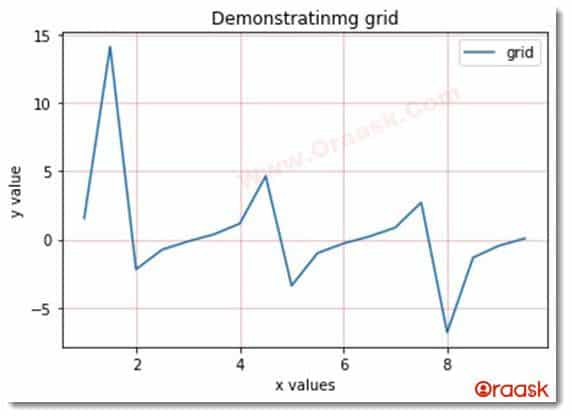
This attribute is used to pass the intensity to the grids. It takes float values between 0 and 1 with both inclusive.0 means no intensity and 1 means full intensity.
Example (6)
import matplotlib.pyplot as plt
import numpy as np
x=np.arange(1,10,0.5)
y=np.tan(x)
plt.grid(visible=True,alpha=0.3,color="red",antialiased=True,clip_on=True)
plt.plot(x,y,animated=True)
plt.xlabel("x values")
plt.ylabel("y value")
plt.legend(["grid"])
plt.title("Demonstratinmg grid")
plt.show()
Output:
Conclusion
In this article, we have learned about the grid in python matplotlib. The grid is used when more information about the graph of the data is needed. In this tutorial, we have shown many attributes and examples. However, it is recommended that the user explore many other attributes on their own to get a better and more precise knowledge about the topic.


