How Can We Help?
In this article, we will learn how to plot a horizontal line in the matplotlib Python library. Matplotlib is one of the most popular Python libraries to visualize data.
How to plot horizontal line in Matplotlib? To plot a horizontal line in Matplotlib, we use the axhline() function. This function creates a horizontal line across the plot with specified parameters such as y-position, color, and linewidth.
Plot Matplotlib Horizontal Line Syntax
matplotlib.pyplot.axhline(y, color, xmin, xmax, linestyle)- y: This is an integer that defines the position on the Y-axis to plot the line.
- xmin and xmax: Range in which line is plotted.
- color: Defines the color for the line; it accepts a string. eg ‘r’ or ‘b’.
- lifestyle: It defines the type of line and accepts a string. like ‘-‘, ‘–’, ‘-.’, ‘:’, ‘None’, ‘ ‘, “, ‘solid’, ‘dashed’, ‘dashdot’, ‘dotted’.
How to plot a Single Matplotlib Horizontal Line
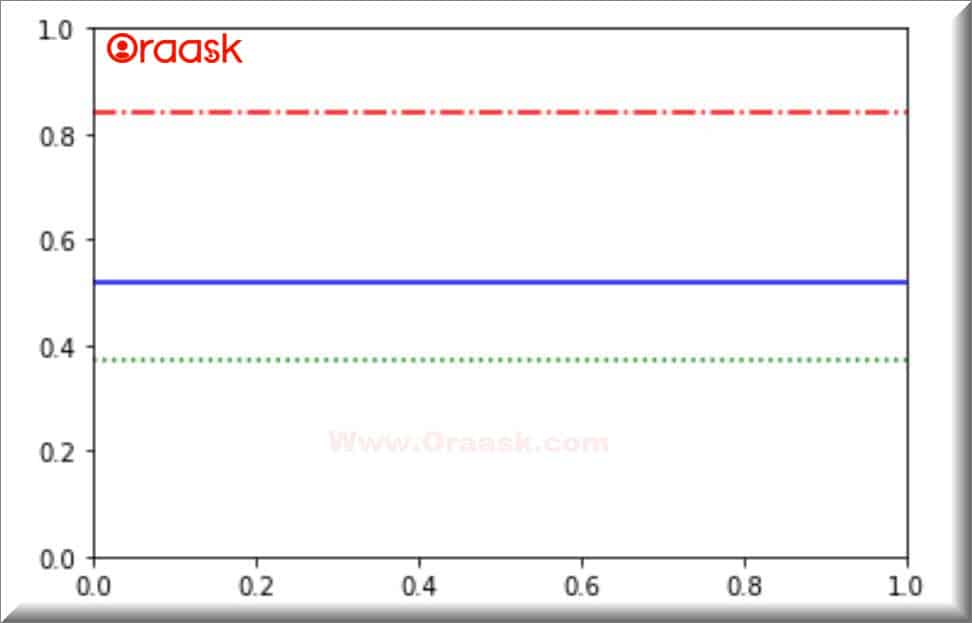
To draw a single line, we can use the axhline() function, which is available in the matplotlib library of python. This is a plotting 1module used for drawing a horizontal line. Below is the example code with the corresponding output.
Example (1):
import matplotlib.pyplot as plt
plt.axhline(y = 0.52, color = 'b', linestyle = 'solid')
plt.axhline(y = 0.84, color = 'red', linestyle = 'dashdot')
plt.axhline(y = 0.37, color = 'green', linestyle = 'dotted')
Output:

Explanation:
- First, we import the matplotlib library using the following command:
import matplotlib.pyplot as plt
Since we need to use the library often, we have imported the big-name -matplotlib. pyplot as plt for convenience. - plt.axline() function will create a horizontal line in the graph.y=0.5 defines the value of y for all the values of x in x axis.
- The color parameter defines the color of the line in the graph. The linestyle parameter defines the style of the scatter points to be used in the graph.
- Finally, the plt.show() function will help to display the graph.
Note: We have a complete study about all types of bar charts in the matplotlib library that you can refer to them from here: Python Matplotlib Bar Chart
How to plot Multiple Matplotlib Horizontal Lines
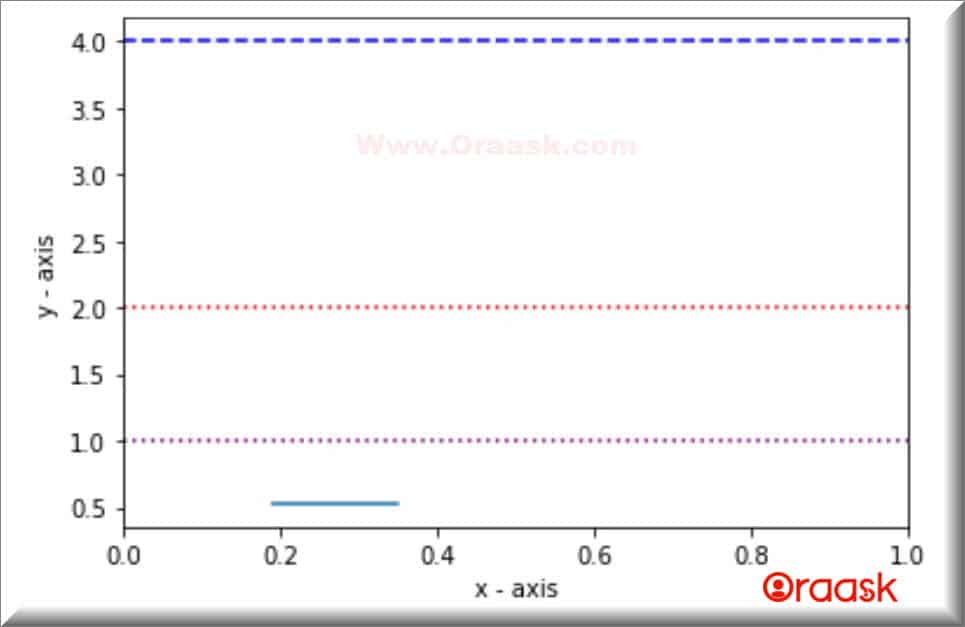
We can draw multiple lines in a graph using the same axhline() function; we need to define the axis points to multiple axhline() functions in the same plan.
Example (2):
import matplotlib.pyplot as plt

plt.axhline(y = .53, xmin = 0.35, xmax = 0.19)
plt.axhline(y = 4, color = 'blue', linestyle = '--')
plt.axhline(y = 2, color = 'red', linestyle = ':')
plt.axhline(y = 1, color = 'purple', linestyle = 'dotted')

plt.xlabel('x - axis')
plt.ylabel('y - axis')

plt.show()
Output:

Adding Legend to the Graph
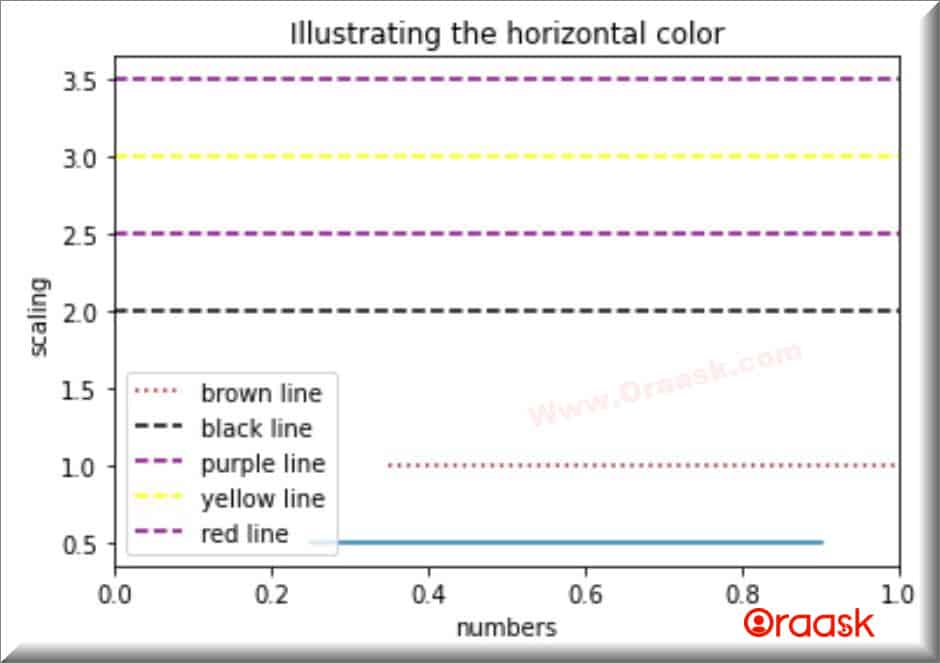
Adding a legend to the graph can make the graph more readable. We can add a legend using the legend() function available in the matplotlib library. See the below code:
Example (3):
import matplotlib.pyplot as plt
plt.axhline(y = 0.5, xmin = 0.25, xmax = 0.9)
plt.axhline(y = 1, color = 'brown',xmin = 0.35, linestyle = ':', label = "brown line")
plt.axhline(y = 2, color = 'black', linestyle = '--', label = "black line")
plt.axhline(y = 2.5, color = 'purple', linestyle = 'dashed', label = "purple line")
plt.axhline(y = 3, color = 'yellow', linestyle = 'dashed', label = "yellow line")
plt.axhline(y = 3.5, color = 'purple', linestyle = 'dashed', label = "red line")
plt.xlabel('numbers')
plt.ylabel('scaling')
plt.legend(loc = 'upper right')
plt.title("Illustrating the horizontal color")
plt.show()
Output:

Explanation:
- For convenience, we have imported the matplotlib. pyplot as plt.
- plt.axhile() function will create the line next. Different line styles are taken in the example. The color attribute is used to segregate the lines in the graphs.
- plt.xlabel() is used to mark what data is carried on the x-axis, and plt. label() is used to mark what data is carried on the y axis.
- Finally, the plt.show() function will help to display the graph.
Conclusion
So in this way, we can plot a horizontal line using the matplotlib library’s axhline() function. We can also plot more than one line in a single plot; we must define the axis points inside the axhline() function.


