How Can We Help?
Introduction
Matplotlib is a powerful library in Python used for data visualization. It provides various tools and functions for creating charts, plots, and graphs. Pie charts are a common type of chart that represents categorical data, where each slice of the pie represents a category and its proportion of the whole. Pie charts can be further enhanced by adding a legend, which helps to identify each slice of the chart and its corresponding category. In this article, we will explore how to create pie charts with legends using Matplotlib.
- Introduction
- Basic Pie Chart
- Adding a Legend to Matplotlib Pie Chart
- Customizing Matplotlib Pie Chart Legend
- Changing the Matplotlib Pie Chart Legend Location
- Changing the Matplotlib Pie Chart Legend Labels
- Adding a Title to the Matplotlib Pie Chart Legend
- Adding a Border to the Matplotlib Pie Chart Legend
- Conclusion
Basic Pie Chart
We can create the pie chart in Marplotlib by using the built-in pie() function. To create a standard pie chart, we need two primary parameters, namely the data points, which are a list of array-like objects, and a list of array-like objects containing the labels, usually in the form of a string. Additionally, we can also use the title, explode, etc., to add other features to the pie chart.
Example (1)
# Import the module in the code
import matplotlib.pyplot as plt
# Define a list containing the data
data = [20, 30, 40, 10]
# Define the labels for the slices
labels = ['A', 'B', 'C', 'D']
# Make a pie chart using the pie function
plt.pie(data, labels=labels, autopct='%1.1f%%')
# Define the title of the pie chart
plt.title("Demonstration of pie chart")
plt.show()
Output:

Explanation:
- First, we imported all the required libraries and packages in the code using the import statement of Python.
- Next, we created a data point named data. We can also create an array like an object for the same.
- Next, we defined another list named labels which contains the names of the pie chart slices.
- We used the pie function to draw the pie chart. We passed the data and the labels as the required function.
- We also specified the autopct attribute, which returns the percentage share of the slices in the pie chart.
- We defined the title using the title function and finally displayed the chart using the show function.
Adding a Legend to Matplotlib Pie Chart
Legends are a specific plot area that helps the readers identify the chart’s different elements. Adding a legend to a pie chart in Matplotlib is a simple process that involves using the legend() function. This function takes in optional arguments, such as the legend’s location, the legend’s title, and the legend size.
Example (2)
# Import the module in the code
import matplotlib.pyplot as plt
# Define a list containing the da
data = [20, 30, 40, 10]
# Define the labels for the slices
labels = ['A', 'B', 'C', 'D']
# Make a pie chart using the pie function
plt.pie(data, labels=labels, autopct='%1.1f%%')
# Define the legend
plt.legend()
# Define the title of the pie chart
plt.title("Demonstration of pie chart")
plt.show()
Output:

Explanation:
- In this code, we added the
legend()function after thepie()function. - The
legend()function automatically detects the labels of the pie chart and adds them to the legend. - The output of this code is a pie chart with a legend showing the labels of each slice.
Check This: There is a full guide on Matplotlib Pie Charts if you want to know more about Polar plot like (What it is and a lot more examples of it).
Customizing Matplotlib Pie Chart Legend
Matplotlib provides several ways to customize the appearance and behavior of the legend in a pie chart. We can change the legend’s location and the legend labels and add a title and a border to the legend.
Changing the Matplotlib Pie Chart Legend Location
To change the location of the legend, we can use the loc parameter of the legend() function. This parameter takes in a string or a tuple that represents the location of the legend.
Here is an example code for changing the location of the legend:
Example (3)
# Import the module in the code
import matplotlib.pyplot as plt
# Define a list containing the da
data = [20, 30, 40, 10]
# Define the labels for the slices
labels = ['A', 'B', 'C', 'D']
# Make a pie chart using the pie function
plt.pie(data, labels=labels, autopct='%1.1f%%')
# Define the title of the pie chart
plt.title("Demonstration of pie chart")
# Define the legend of the pie chart
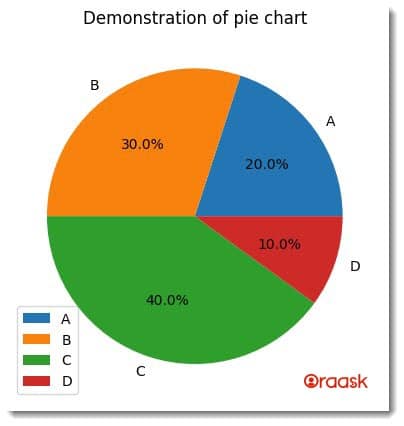
plt.legend(loc='lower left')
plt.show()
Output:

In this code, we set the loc parameter to ‘lower left’, which moves the legend to the lower-left corner of the chart.
Changing the Matplotlib Pie Chart Legend Labels
We can use the get_texts() method of the legend object to change the legend labels. This method returns a list of Text objects representing the legend’s labels. We can then modify the text of each label by accessing its properties and methods.
Example (4)
# Import the required module
import matplotlib.pyplot as plt
# Set the figure size for the plot
plt.figure(figsize=(9,9))
# Define the data for the pie chart
data = [20, 30, 40, 10]
labels = ['A', 'B', 'C', 'D']
# Plot the pie chart with labels and autopct format
plt.pie(data, labels=labels, autopct='%1.1f%%')
# Create a legend object for the pie chart
leg = plt.legend()
# Change the label text of the first slice in the legend
leg.get_texts()[0].set_text('Category A')
# Make the label text of the second slice bold and italic in the legend
leg.get_texts()[1].set_text('Category B\n(30%)')
leg.get_texts()[1].set_fontweight('bold')
leg.get_texts()[1].set_fontstyle('italic')

# Display the plot
plt.show()
Output:

Explanation:
- We first create the pie chart and add a legend in this code.
- We then get the list of Text objects representing the legend labels using the
get_texts()method of the legend object. - We can then access the properties and methods of each Text object to modify its label text. In this example, we changed the label text of the first slice to ‘Category A‘ and made the label text of the second slice bold and italic.
Check This: There is a full guide on How to Use Matplotlib Legend if you want to know more about matplotlib legends.
Adding a Title to the Matplotlib Pie Chart Legend
Sometimes our chart may be too complex, and we may need to exclusively mention the title of the legend, whether to tell the purpose or to tell the context of the legend. To add a title to the legend, we can use the title parameter of the legend() function. This parameter takes in a string that represents the title of the legend.
Example (5)
import matplotlib.pyplot as plt
# Set the figure size for the plot
plt.figure(figsize=(9,9))
data = [20, 30, 40, 10]
labels = ['A', 'B', 'C', 'D']
plt.pie(data, labels=labels, autopct='%1.1f%%')
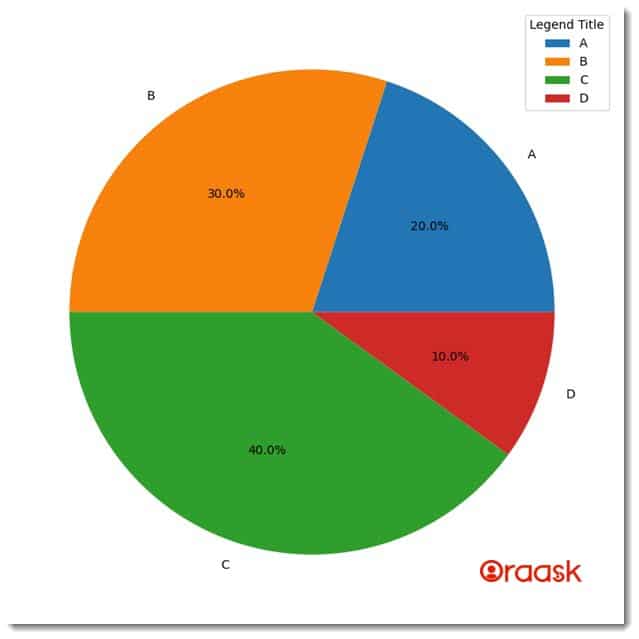
plt.legend(title='Legend Title')
plt.show()
Output:

In this code, we set the title parameter of the legend() function to ‘Legend Title‘, which adds a title to the legend.
Adding a Border to the Matplotlib Pie Chart Legend
Border refers to the visible boundary around a particular card or similar graphical elements. Programmers may want to add borders to the legend to make it more attractive. To add a border to the legend, we can use the set_frame_on() method of the legend object. This method uses a boolean value representing whether to display a border around the legend.
Example (6)
# Import the required module
import matplotlib.pyplot as plt
# Set the figure size for the plot
plt.figure(figsize=(9,9))

# Define the data for the pie chart
data = [20, 30, 40, 10]
labels = ['A', 'B', 'C', 'D']
# Plot the pie chart with labels and autopct format
plt.pie(data, labels=labels, autopct='%1.1f%%')
# Create a legend object for the pie chart
leg = plt.legend()
# Turn on the frame of the legend
leg.set_frame_on(True)
# Display the plot
plt.show()
Output:

Explanation:
- We first Import the required module.
- Then set the figure size for the plot.
- After that define the data for the pie chart.
- Plot the pie chart with labels and autopct format.
- Then create a legend object for the pie chart.
- Then turn on the frame of the legend by calling
leg.set_frame_on(True) - The last line is for display the plot
Conclusion
In this article, we explored how to create pie charts with legends using Matplotlib. We started by creating a basic pie chart and then adding a legend. We then showed how to customize the appearance and behavior of the legend by changing its location, labels, title, and border. When creating pie charts with legends, it is crucial to choose appropriate colors, labels, and locations for the legend to ensure that the chart is easy to read and understand. We hope this article has provided valuable tips and best practices for creating Matplotlib pie chart legends.


