How Can We Help?
The counter graph is a three-dimensional plot representing the plot through a three-dimensional surface by plotting uniform slices along the z-axis. Contour graphs are used to plot the relationship between two independent variables, x, and y, and one dependent variable, say z. Hence the z is a function of x and y. The contour graph helps to precisely identify some optimal value of a function with two variables.
Although the visualization is done in three dimensions, it is done to visualize the three-dimensional plot in two dimensions.
Creating a Simple Contour Plot
Plotting the contour graph in matplotlib can be done with the help of the contour3D() function of matplotlib.pyplot module. The function takes three necessary arguments. However, another essential argument is the number of slices along the z-axis. It is optional to pass this argument, but it is highly recommended to use it to visualize the plot better.
The x, y, and z should be list or numpy object data types only. Also, the x and y should be a dimensional array, whereas the z should be a two-dimensional array. Otherwise, Python will throw an error while executing.
Example (1)
# Import all the necessary libraries and packages in the code
import numpy as np
import matplotlib.pyplot as plt
# Creating a user-defined function called contour
def contour(x, y,z):
    # Creating the figure object
    fig = plt.figure(figsize=(9,9))
    # Creating the axes object
    ax = plt.axes(projection='3d')
    # Plotting the contour graph
    ax.contour3D(x,y,z,100)
    # Defining the x label
    ax.set_xlabel('This is the x axis')
    # Defining the y label
    ax.set_ylabel('This is the y axis')
    # Defining the z label
    ax.set_zlabel('This is the z axis')
    # Passing title to the graph
    ax.set_title('Demonstrating contour graph')
    # Displaying the contour graph
    plt.show()
# Creating the main() function
def main():
    # Defining the data point for the x-axis
    x = np.arange(0,200,30)
    # Defining the data point for the y axis
    y = np.arange(0,200,100)
    # Creating a two-dimensional mesh grid from x and y values
    x,y= np.meshgrid(x, y)
    # Defining the z-axis
    z = np.sin(x)+np.cos(x)
    # Calling the contour function
    contour(x, y, z)
# Calling the main() function
if __name__ == "__main__":
    main()
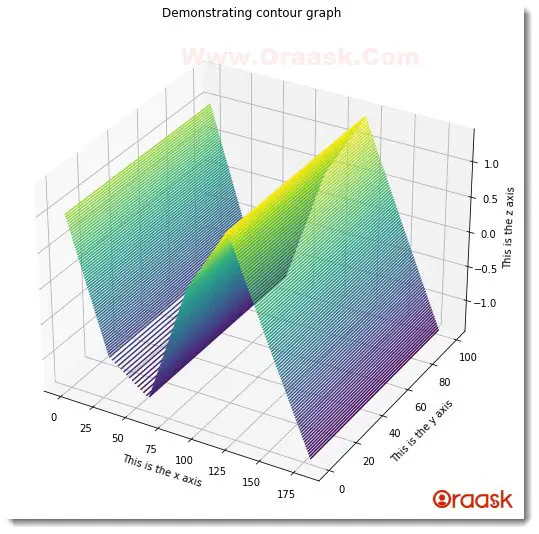
Output:

Explanation:
- First, we imported all the necessary libraries and packages in our code with the help of the import statement of Python. We imported the matplotlib.pyplot module and numpy library in the code.
- Next, we created a user-defined function called contour in the code. This function takes three parameters, namely x, y, and z. Under the function, we first created the figure object using the figure () function of matplotlib. Next, we created the axes object using Python’s axes () function. We specified the attribute projection = “3d” to make a three-dimensional workspace.
- Next, we used the contour3D() function to plot the contour function. We passed the x, y, and z arguments in the function. We also provided another argument -an integer value determining the number of slices required in the plot. We specified the number of slices to be 100.
- Next we also specified the labels of the axes using the set_xlabel(),set_ylabel() and set_zlabel() functions. We also set the title to the plot using the set_title() function. We used the plt.show() function to display the plot. However, this is optional to use in Jupyter Notebook.
- Next, we created the main () function. The main () function is the main driving code of the program. Under this function, we first created the data point for the x-axis using the np.arange() function. Next, we have created the data point for the y-axis. We used the meshgrid() function to create a two-dimensional array with the data points representing the points of x and y variables.
- We then used the values of x and y to plot a function which is z= f( x , y) = sin x+ cos(x).
- We called the contour function and passed the x, y, and z values to plot the figure. Finally, we called the main () function using the following lines of codes:
if __name__ == “__main__”:
main ()
Check This: There is a full guide on Matplotlib 3D Bar Chart if you want to know more about 3D Charts.
More Examples of Three-Dimensional (3D) Contour Plots
As we have discussed how to plot the contour plots in python matplotlib, let us now practice how to plot different functions in contour plots. Note that we need to first define the data points for plotting the graph. We need to ensure that x and y assume a one-dimensional array and z is a function of x and y. Hence z is the dependent variable, whereas x and y are the independent variables.
Example (2)
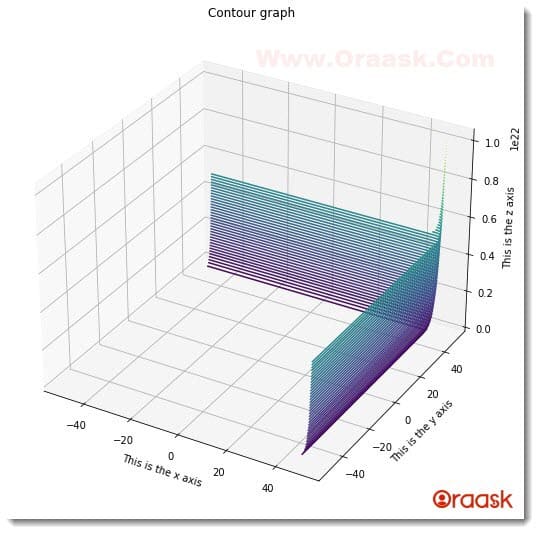
Plot the function z= f (x , y ) = ex+ ey
Code:
# Import all the necessary modules and functions in the code
import numpy as np
import matplotlib.pyplot as plt
# Create a user-defined function named counter()
def contour(x, y, z):
    # Next, create a figure object using the figure () function
    fig = plt.figure(figsize=(9, 9))
    # Creating the figure axes
    ax = plt.axes(projection='3d')
    # Plotting the graph.
    wireframe_graph = ax.contour3D(x, y, z, 100)
    # Defining the title of the plot
    plt.title("Contour graph")
    # Defining the x label
    ax.set_xlabel('This is the x axis')
    # Defining the y label
    ax.set_ylabel('This is the y axis')
    # Defining the z label
    ax.set_zlabel('This is the z axis')
    # Displaying the plot
    plt.show()
# Creating the main () function
def main():
    # Creating data points for the x-axis
    x = np.linspace(-50, 50, 100)
    # Creating data points for the y axis
    y = np.linspace(-50, 50, 100)
    # Creating mesh grid out of the values of x and y
    x, y = np.meshgrid(x, y)
    # Creating data points for the z-axis
    z = np.exp(x)+np.exp(y)
    # Calling the contour () function
    contour(x, y, z)
# Calling the main() function
if __name__ == "__main__":
    main()
Output:

Example (3)
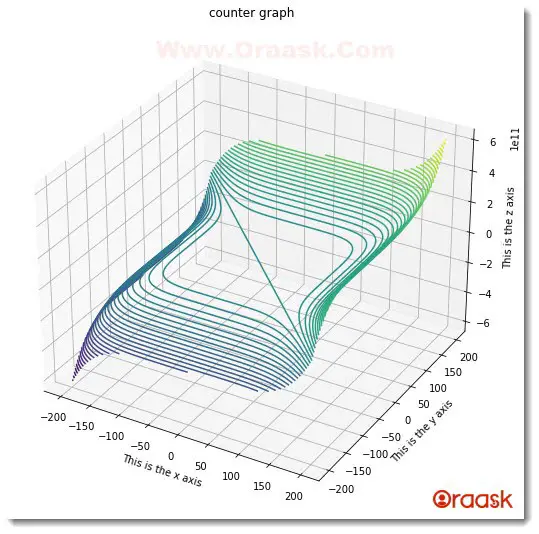
Plot the function z = f(x , y ) = x5 + y5
Code:
# Import all the necessary modules and functions in the code
import numpy as np
import matplotlib.pyplot as plt
# Create a user-defined function named contour()
def contour(x, y, z):
    # Next, create a figure object using the figure () function
    fig = plt.figure(figsize=(9, 9))
    # Creating the figure axes
    ax = plt.axes(projection='3d')
    # Plotting the graph.
    contour_graph = ax.contour3D(x, y, z, 80)
    # Defining the x label
    ax.set_xlabel('This is the x axis')
    # Defining the y label
    ax.set_ylabel('This is the y axis')
    # Defining the z label
    ax.set_zlabel('This is the z axis')
    # Defining the title of the plot
    plt.title("contour graph")
    # Displaying the plot
    plt.show()
# Creating the main () function
def main():
    # Creating data points for the x-axis
    x = np.linspace(-200, 200, 200)
    # Creating data points for the y axis
    y = np.linspace(-200, 200, 200)
    x, y = np.meshgrid(x, y)
    # Creating data points for the z-axis
    z = np.power(x, 5)+np.power(y, 5)
    # Calling the contour () function
    contour(x, y, z)

# Calling the main() function
if __name__ == "__main__":
    main()
Output:

Example (4)
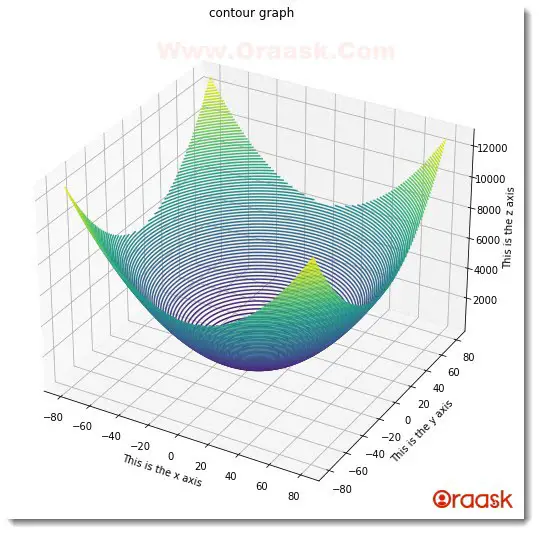
Plot the function z = f( x , y )= x2 + y2
Code:
# Import all the necessary modules and functions in the code
import numpy as np
import matplotlib.pyplot as plt
# Create a user-defined function named surface ()
def contour(x, y, z):
    # Next, create a figure object using the figure () function
    fig = plt.figure(figsize=(9, 9))
    # Creating the figure axes
    ax = plt.axes(projection='3d')
    # Plotting the graph.
    surface_graph = ax.contour3D(x, y, z, 100)
    # Defining the x label
    ax.set_xlabel('This is the x axis')
    # Defining the y label
    ax.set_ylabel('This is the y axis')
    # Defining the z label
    ax.set_zlabel('This is the z axis')
    # Defining the title of the plot
    plt.title("contour graph")
    # Displaying the plot
    plt.show()
# Creating the main() function
def main():
    # Creating data points for the x-axis
    x = np.outer(np.linspace(-80, 80, 100), np.ones(100))
    # Creating data points for the y axis
    y = np.linspace(-80, 80, 100)
    x, y = np.meshgrid(x, y)
    # Creating data points for the z-axis
    z = np.power(x, 2)+np.power(y, 2)
    # Calling the contour() function
    contour(x, y, z)
# Calling the main() function
if __name__ == "__main__":
    main()
Output:

Conclusion
This article taught us how to plot the contour graphs in python matplotlib. The contour3D() function is used to plot the contour graphs. The function takes three primary arguments for the values along the x, y, and z-axis. Among them, x and y should be a one-dimensional array, and z should be a two-dimensional array. Besides these, we also learned the usage of many numpy functions like linspace(), arange(), etc.
We have most of the crucial concepts related to plotting the contour graph. However, we strongly recommend the readers look up the python matplotlib documentation to have more understanding of the topics.


