How Can We Help?
Time is a very crucial element in our day-to-day life. Matplotlib allows us to plot the time, whether discrete or continuous time forecasting. In real life, it has a very significant application. Engineers need to plot a snapshot of time over an event keeping in mind other constraints to design circuits. This is one of the most critical aspects of our communication system. There are a lot of applications where plotting the time is significantly essential.
In this article will learn how to plot time in Python Matplotlib.
Plotting Time Manually
At a fundamental level, we can plot the time manually using all the basic libraries and modules in matplotlib. We can create the data points on our own in the form of a list or some numpy-like object. We can convert the numbers into a date or time format using the DateTime library of python. However, for such manual plotting of the data, we need to pass the values for the y parameter for plotting the points in matplotlib using the plot_date() function. This is because we need to let the interpreter know at what height the facts are required to place it in the figure.
Example (1)
#import all the necessary libraries and modules in the code
import matplotlib.pyplot as plt
import matplotlib.dates
from datetime import datetime
#defining the main() function
def main():
    #defining the x values in the code
    x_values = [datetime(2022, 8, 16, 10), datetime(2022, 8, 16, 11), datetime(2022, 8, 16, 12)]
    #defining the y values in the code.
    y_values = [1.0, 1.0, 1.0]
    #defining the size of the plot
    plt.figure(figsize=(9,9))
    #plotting the values manually in the code.
    plt.plot_date(x_values, y_values)
    #definign the label along the x-axis
    plt.xlabel("Dates")
    #defining the label along the y axis
    plt.ylabel("Height")
    #defining the title of the plot
    plt.title("Displaying time in matplotlib")
    #displaying the plot
    plt.show()
#calling the main() function
if __name__=="__main__":
main()Output:

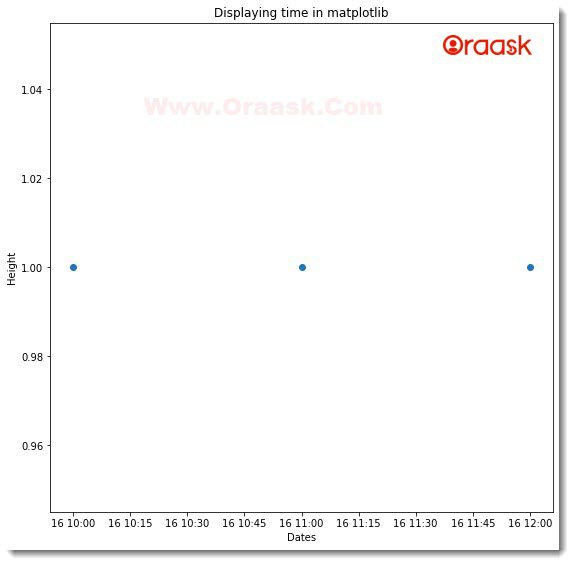
Explanation:
- First, we imported all the necessary libraries and modules in the code using the import statement of python. We have used the alias names to make it easy for us to write the codes further. We imported the matplotlib.pyplot as plt,matplotlib.dates, and datetime module from the datetime library in python.
- Next, we created the main() function, which is the main driving code of the program. Under this function, we first created the values for the x-axis, which will consist of the dates and times. We used the datetime function to convert the numbers into the date format. We took three data points here in the plot. The user can plot as many data points as they want in the code.
- Next, we set the y values for the plot. Note that it has nothing much to do with the logic of the code. It simply defines at what height in the figure we need to plot the points.
- Next, we set the size of the figure using the figsize attribute of the plt.figure() function. We passed (9,9) as the value of the attribute. Next, we plotted the values in the plot using the plt.plot_dates() function of matplotlib. We passed two parameters first, the values along the x-axis x_values, and second the values along the y-axis y_values. We also set labels to the plot using the plt. xlabel() and plt.ylabel() function.Next, we defined the plot’s title using the plt.title() function. At last, displayed the plot using the plt.show() function. Note that this is optional for the Jupyter notebook. Even if we do not pass this statement, the Jupyter notebook will display the plot.
- Finally, we used the following lines of code to declare the main() function as the driving function of our code.
In the above code, we learned how to plot the time manually using the DateTime and matplotlib libraries. However, the user probably won’t like to pass the values manually. Instead, users often prefer to automate the process using the code itself and plot the graph.
How to Plot Time in Matplotlib using the Current Time?
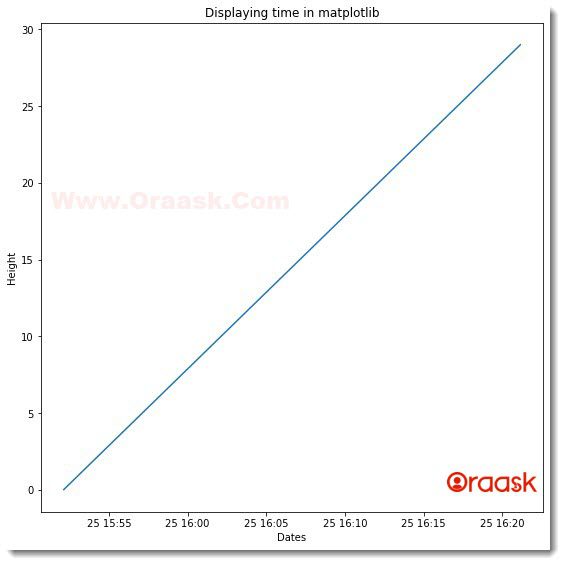
Users will most probably want to plot the time. However, plotting the time on the plot will give us a starlight line graph. If we want to plot the time in matplotlib using the current time, we will always find the graph linearly with slope 1 and intercept 0.
Example (2)
#import all the necessary libraries and modules in the code
import matplotlib.pyplot as plt
import matplotlib.dates
from datetime import datetime
import datetime
import random
#defining the main() function
def time_plot(x,y):
    #defining the size of the plot
    plt.figure(figsize=(9,9))
    #plotting the values manually in the code.
    plt.plot(x, y)
    #defining the label along the x-axis
    plt.xlabel("Dates")
    #defining the label along the y-axis
    plt.ylabel("Height")
    #defining the title of the plot
    plt.title("Displaying time in matplotlib")
    #displaying the plot
    plt.show()
def main() :
    #defining the x values
    x = [datetime.datetime.now() + datetime.timedelta(minutes=i) for i in range(30)]
    #defining the y values
    y = [int(x) for x in range(0,30)]
    time_plot(x,y)
#calling the main() function
if __name__=="__main__":
main()Output:

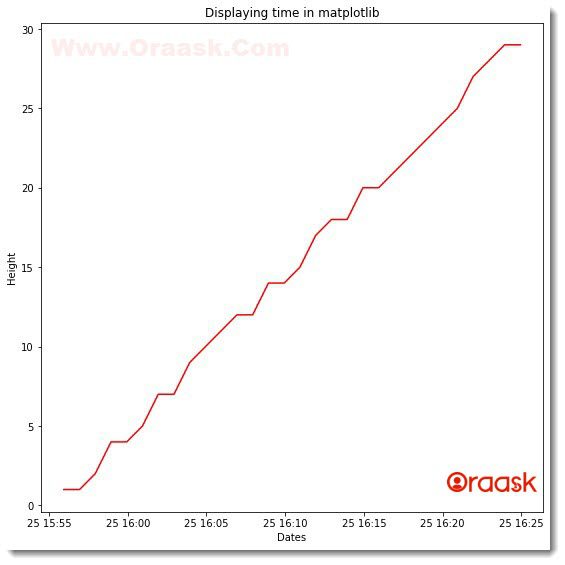
The above output is expected because here we are plotting time which is a linear quantity vs. another linear quantity. In real life, however, the engineers are interested in plotting the snapshot of time over an event. For example, plotting the snapshot of a wave, etc. Let us have a more helpful demonstration of plotting the time.
Example (3)
#import all the necessary libraries and modules in the code
import matplotlib.pyplot as plt
import matplotlib.dates
from datetime import datetime
import datetime
import random
#defining the main() function
def time_plot(x,y):
    #defining the size of the plot
    plt.figure(figsize=(9,9))
    #plotting the values manually in the code.
    plt.plot(x, y,color='red')
    #defining the label along the x-axis
    plt.xlabel("Dates")
    #defining the label along the y-axis
    plt.ylabel("Height")
    #defining the title of the plot
    plt.title("Displaying time in matplotlib")
    #displaying the plot
    plt.show()
def main() :
    #defining the x values
    x = [datetime.datetime.now() + datetime.timedelta(minutes=i) for i in range(30)]
    #defining the y values
    y = [int(random.randint(0,1)+x) for x in range(0,30)]
    time_plot(x,y)
#calling the main() function
if __name__=="__main__":
    main()
Output:

Explanation:
- First, we imported all the necessary libraries and modules into the code. We have imported matplotlib.pyplot, datetime, random library, etc., in the code.
- Next, we created a user-defined function named time_plot() which takes two parameters, x, and y. Under this function, we first defined the figure size of the figure using the figsize attribute. We then plotted the x and the y values in the code using the plot() function of matplotlib. We also set the color to the plt using the color attribute of matplotlib. We set it to red. Next, we created the x and y-axis labels using the xlabel() and ylabel() functions. We then defined the plot’s title using the title() function and displayed the plot using the plt.show() function.
- Next, we created the main() function, which is the main driving code of the program. Under this function, we created the data points for the plot. We created the values for the x-axis using the list data type. We first accessed the current time using the datetime.datetime.now() function. Next, by the list comprehension method, we repeatedly added one minute to the time for 30 times. We did this using the following lines of codes:
- x = [datetime.datetime.now() + datetime.timedelta(minutes=i) for i in range(30)]
- Next, we created data points for the y-axis using list comprehension. We used the random.randint() function to access a random integer in the code and increment it by one unit each time. The entire thing was done using the following lines of code:
y = [int(random.randint(0,1)+x) for x in range(0,30)]
- We then called the time_plot() function in the code by passing the necessary arguments.
- Finally, we called the main function using the following lines of codes:
if __name__==”__main__”:
main()
We can plt different types of charts to plot the time. We can use bar charts, horizontal bar charts, scatter charts, line charts, etc., to plot. Any specific chart does not confine us for the plt.
Conclusion
In this article, we have learned how to plot time in matplotlib. We have used the datetime,matplotlib, and random libraries to achieve the same. However, these are not the only ways the coders can plot the time. We can design several other algorithms to plot the time in matplotlib too.
We have covered most of the points on how to plot time in matplotlib. However, we recommend the user to look at python documentation to know more functions and attributes related to the mentioned libraries and modules.


