How Can We Help?
Matplotlib is a stylish python package for data visualization and is used for many other tasks like animations, graphics, etc.
What is Matplotlib Axis?
Axes are a class in matplotlib and are used for creating subplots in Python. Axis is mainly used to place the plots within the figure. The axis can be both two-dimensional as well as three-dimensional. The two-dimensional axes are known as 2D, and 3D represents the three-dimensional. It should be noted that a particular plot or figure may contain many axes, but particular axes may contain only one figure at a time.
In this article, we will understand the axes class, the attributes, and the associated functions.
Let us start by creating our primary axes.
Example (1)
#importing the libraries
import matplotlib.pyplot as plt
#creating the user-defined function axes()
def axes(x):
    fig=plt.figure()#creating the figure class.
    ax=plt.axes(x)
    plt.show()
#creating the main function.
def main():
    x=[0.5,0.5,1,1]
    axes(x)
if __name__ == "__main__":
    main()
Output:

Explanation:
The above code can be explained as follows:
- First, we have imported all the necessary libraries using the import statement. We have imported the matplotlib.pyplot module and used the alias name for the convention.
- Next, we created a user-defined function named axes(). It takes only one argument, namely x. Here the x should be of list or some array object data type. Now we used the figure() function to create the figure class and named it the fig class.
- Next, we created the axes class and used the axes() function to create the axes class. We passed argument “x” on the same.
- Next, we used the plt.show() function to display the axes in the plot.
- Now we created the main function. This is the central part of the code. We created a list named “x” and passed 4 values to the list. The four elements represent the axes’ left, bottom, width, and height.
- We then called the axes function and passed the list as the function’s argument.
- Finally, we specified the main() function as the central part of the program using the following statements:
if __name__ == “__main__”:
main()
However, the above figure does not have much information, and hence we can think of adding titles, labels, etc., to the axes to make it more informative.
Example (2)
#importing the libraries
import matplotlib.pyplot as plt
#creating the axes() function.
def axes(x):
    fig=plt.figure()#creating the figure class.
    ax=plt.axes(x)#creating the axes class.
    plt.title('Demonstrating the axes')#setting title to the plot.
    plt.xlabel('X label')
    plt.ylabel('Y label')
    plt.show()
#creating the main function.
def main():
    x=[1,1,2,2]#creating the x variable.
    axes(x)
#calling the main function.
if __name__ == "__main__":
    main()
Output:

Analyzing the List Parameter:
Let us understand the four numbers we have sent to the axes class. They represent the axes class’s left, bottom, width, and height.
- The left argument defines the distance between the axes’ left side and the figure’s border.
- The bottom argument represents the distance between the axis’s lowest point and the figure’s order.
- The width argument represents the distance between the axes’ left and right borders.
- The height argument represents the distance between the figure’s upper and the bottom-most side.
add_axes() Method:
We can also use the add_axes() function instead of the axes class.
Example (3)
#importing the libraries
import matplotlib.pyplot as plt
def Add_axes(x):
    fig=plt.figure()#creating the figure class.
    ax=fig.add_axes(x)#creating the axes class.
    plt.title('Demonstrating the axes class using add_axes')#setting the title to the plot.
    plt.xlabel('X label')#assigning the x label.
    plt.ylabel('Y label')#assigning the y label.
    plt.show()
#creating the main() function.
def main():
    x=[1, 1, 2, 1]
    Add_axes(x)
#calling the main function.
if __name__ == "__main__":
    main()
Output:

Plot the Figures using ax.plot() Function
We can use the ax.plot() function to plot the figures. The methods are very similar to the plt.plot() function. We need to create the axes class, then use the function along with other functions and attributes.
Example (4)
#import all the necessary modules and libraries
import matplotlib.pyplot as plt
import numpy as np
#create the function for plotting the axes class
def Add_axes(params,x,y1,y2):
    fig=plt.figure()#creating the figure class.
    ax=fig.add_axes(params)
    ax1=ax.plot(x,y1)#plotting the axes.
    ax2=ax.plot(x,y2)
    ax.legend(labels=("sin(x)", "cos(x)"))#adding the labels
    ax.set_title("Cosine and sine functions")
#creating the main function
def main():
    x=np.arange(1,10,0.1)
    y1=np.sin(x)
    y2=np.cos(x)
    params=[1, 1, 2, 1]
    Add_axes(params,x,y1,y2)
#calling the main function
if __name__ == "__main__":
    main()
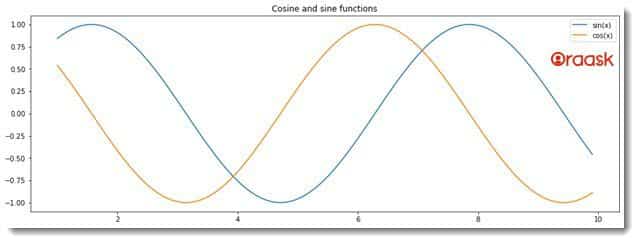
Output:

Explanation:
The above code can be explained as follows:
- First, we imported all the necessary libraries into the code. Here we have imported the matplotlib.pyplot and the numpy library. Both of which we have imported using the alias names for convenience.
- We then created a user defined function called add_axes().It takes four arguments namely params,x,y1,y2.
- Now under the function, we have created a figure class using the plt.figure() function.
- Next, we created the axes class using the add_axes() function. Here we have passed the argument params.
- Now we have created the axes classes to plot the graphs. We have created two object variables, “axes1” and “axes2“. We passed two arguments to each. For the formal one, we passed “x” and “y1“, and for the latter one, we passed “x” and “y2” as the parameters.
- We used the plot() function to plot the figures.
- We also added the legends using the legend() function.
- We then set the title using the set_title function.
- After that, we created the main() function. We created a variable x using the numpy library and the arrange() function. We took the limit from 1 to 10.
- We then made two other variables, called “y1” and “y2“. We created the sine and cosine function data points.
- We created another variable, namely the params. It is a list containing the arguments regarding the dimensions of the axes. We then called the add_axes() function and passed all the necessary arguments.
- At last, we called the main() function using the following code:
if __name__ == “__main__”:
main()
Conclusion
In this article, we learned the basics of the matplotlib axes class. Although we discussed the most important and commonly used functions, it is recommended for the user to check the python matplotlib documentation to explore more functions,*args as well as **kwargs.


