How Can We Help?
Matplotlib is one of the most popular libraries of python. It is widely used for plotting graphs, animations, etc. Many times, the programmers need to plot vertical lines in the plot. This can be to separate two graphs or make another distinction.
This article will teach us how to plot vertical lines in the matplotlib.
Create Single Vertical Line
Plot Single Vertical Using axvline() Method:
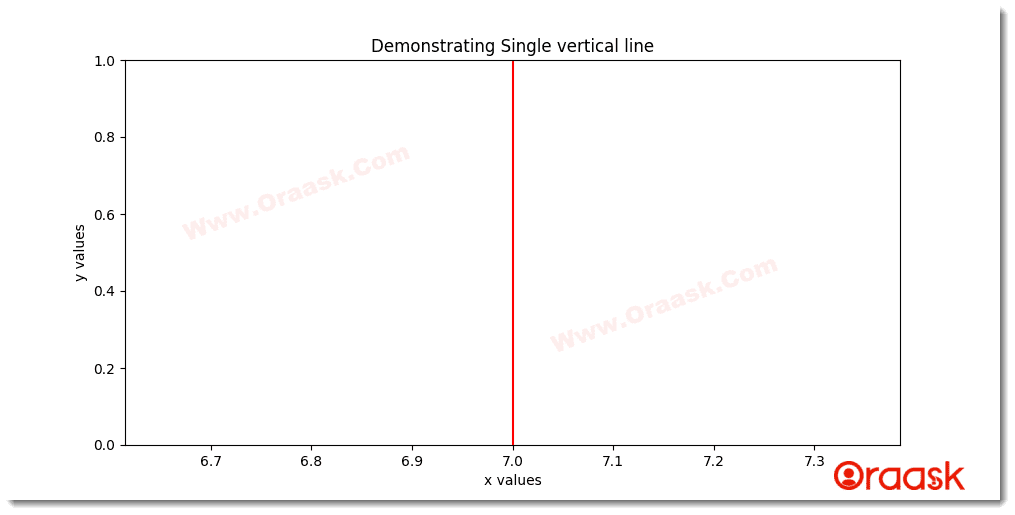
This is one of the most popular ways to create vertical lines in matplotlib. As the name suggests, this function will create a vertical axis line.
Example
import matplotlib.pyplot as plt
def vertical_line():
    plt.figure(figsize=(10,5))
    plt.axvline(x=7,color="red")
def main():
    vertical_line()
if __name__ == "__main__":
    main()
Output
Explanation
The above code can be explained as follows:
- We first imported all the necessary libraries in the code using the import statement. We imported the matplotlib.pyplot module here. We used the alias name for convenience.
- We then created a user-defined function named vertical_line. It takes no parameter.
- We created a figure class using the figure() function. Then we passed the figsize attribute to specify the size of the figure. We specified 10 and 5 as the values here.
- We then used the axvline() function to plot the vertical lines in the plot. We specified color argument to the vertical line and red as its color. We also passed another argument -the value of x. Here x=7 means that the vertical line should be on x=7.
- We then created the main() function. This is the main part of the code. We called the vertical_line() function without passing any argument.
- We finally called the main function using the following code:
if __name__ == "__main__":
                main()
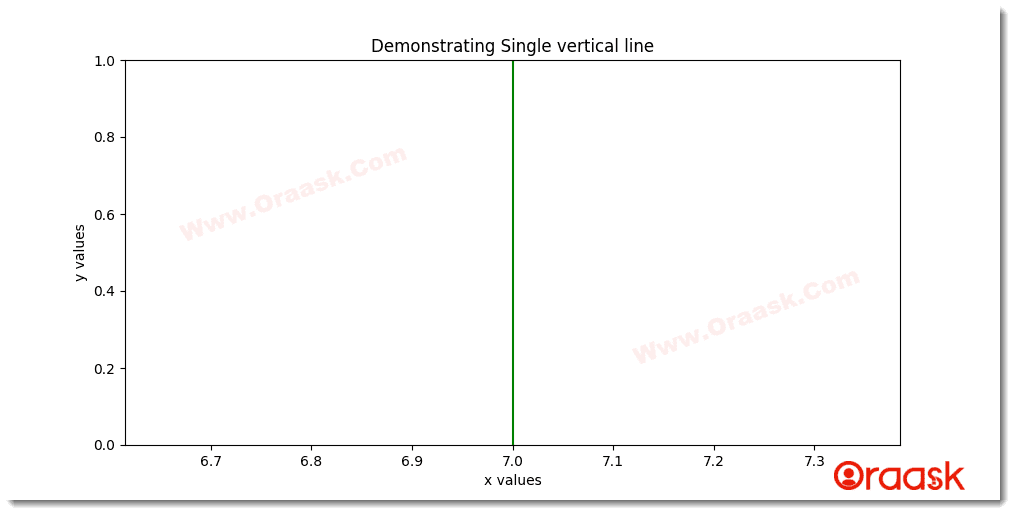
We can also add many other attributes to the plot, just like we do for any other plot.
Example
import matplotlib.pyplot as plt
def vertical_line():
    plt.figure(figsize=(10,5))
    plt.xlabel("x values")
    plt.ylabel("y values")
    plt.axvline(x=7,color="green")
    plt.title("Demonstrating vertical line")
    plt.show()
def main():
    vertical_line()
if __name__ == "__main__":
    main()
Output
Plot Single Vertical Line Using vlines() Method:
Another method is to use the vlines() method. This also does the same functionality as that of the previous one. However, this is more popularly used with datasets.
Associated parameters:
- x: The coordinate of x on which the vertical line is to be displayed.
- color: Color of the vertical line
- lifestyle: The style of the vertical line to be used. There are many styles available. For example, ‘-’,’:’ etc.
- ymin: The lowest y value of the vertical line.
- ymax: The highest y value of the vertical line.
Example
import matplotlib.pyplot as plt
def vertical_line():
    plt.figure(figsize=(10,5))
    plt.xlabel("x values")
    plt.ylabel("y values")
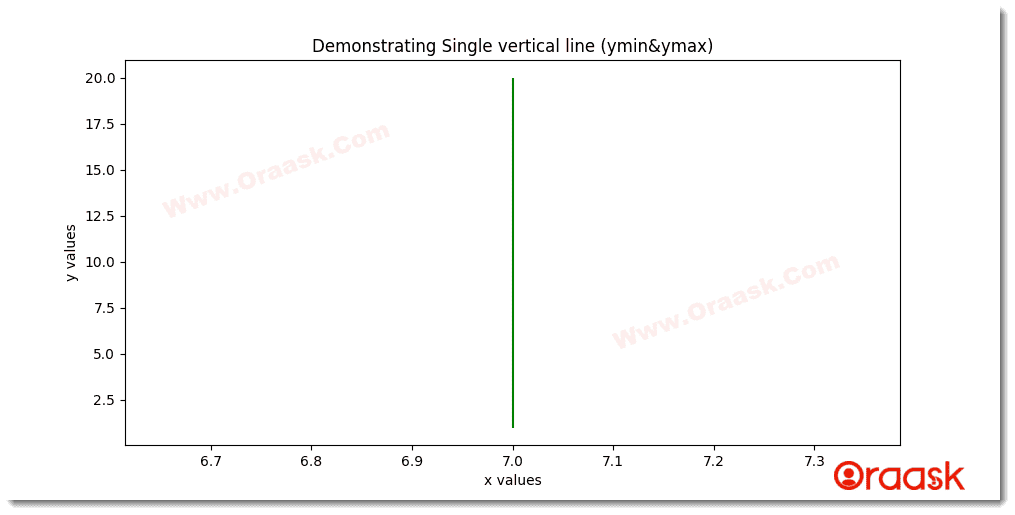
    plt.vlines(x=7,color="green",ymin=1,ymax=20)
    plt.title("Demonstrating vertical line")
    plt.show()
def main():
    vertical_line()
if __name__ == "__main__":
    main()
Output
Explanation
The above code can be explained as follows:
- We imported all the necessary modules and libraries into the code. Here we imported the matplotlib. pyplot using their alias name as plt
- Now we created the user-defined function called vertical_line() function.We then created the figure class using the figure() function. We specified the size of the figure.
- We passed the xlabel and the ylabel using the xlabel() and ylabel() functions, respectively.
- We then plotted the vertical lines using the vlines() function. We first passed the value of x to the coordinate where the vertical line should lie. Then we passed other parameters like the color,y limits, etc.
- We also passed the title to the plot. Finally, we displayed the plot using the plt.show() function.
- We then created the main function, which we called the vertical_line() function.
Finally, we called the main function using the following code:
if __name__ == "__main__":
               main()
Plot Single Vertical Line Using plot() Function:
The plot() function is mainly used for plotting 2D plots. We need to specify a unique technique to get the figure’s vertical line. The function is not specific to plotting the vertical lines only. Hence we need to pass specific parameters to the function to get the vertical line.
We need to pass the following arguments :
(start x value,end x value),(start y value, end y value)
Example
import matplotlib.pyplot as plt
def vertical_line(x,y1,y2):
    plt.figure(figsize=(10,5))
    plt.xlabel("x values")
    plt.ylabel("y values")
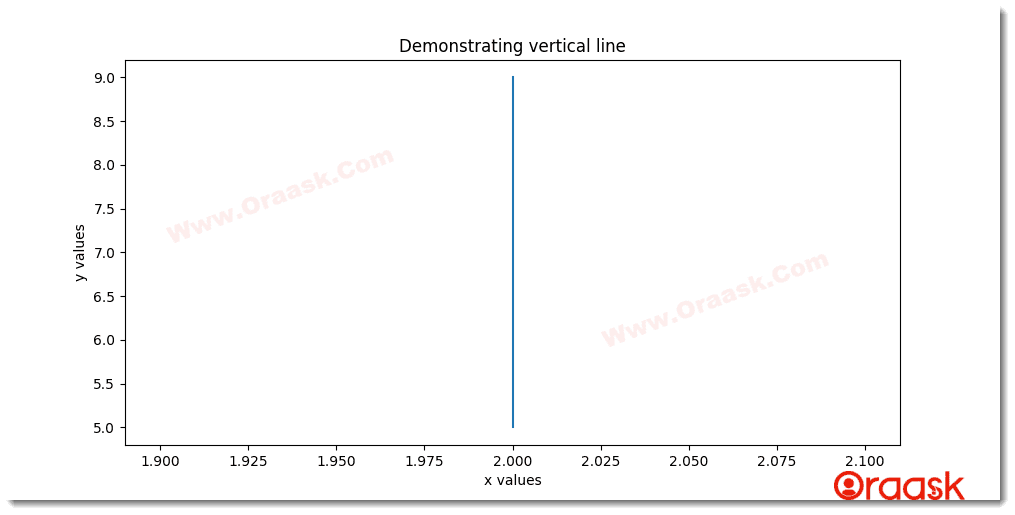
    plt.plot((x,x),(5,9))
    plt.title("Demonstrating vertical line")
    plt.show()
def main():
    x=2
    y1=2
    y2=7
    vertical_line(x,y1,y2)
if __name__ == "__main__":
    main()
Output
Explanation
The above code can be explained as follows:
- We imported the necessary modules using the alias names using the import statement.
- We created a vertical_line() function.It will take three parameters x,y1, and y2. We created the figure class using the figure() function.
- We then created the labels using the xlabel() and the ylabel() functions.
- We plotted the vertical line using the plt.plot() function. For that, we gave the following arguments :
(x,x),(5,9)
- We then set the title of the plot and finally displayed the plot.
- Now we created the main() function. Here we specified the values of x, y1, and y2.We then called the vertical_line() function and passed x,y1,y2 as the arguments.
- Finally, we called the main() function using the following code:
if __name__ == "__main__":
    main()
Note: We have written an article about the horizontal lines that you can read here: How to plot Horizontal Lines in Matplotlib.
Create Multiple Vertical Lines:
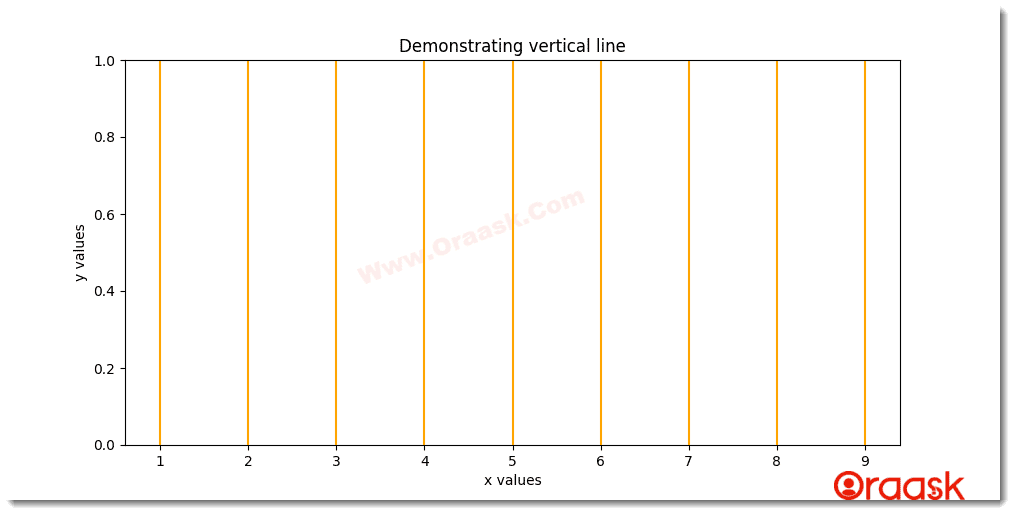
We can also create multiple vertical lines in matplotlib. For this, we need to use multiple such functions.
Plot Multiple Vertical Lines Using axvlines() Function:
Example
import matplotlib.pyplot as plt
def vertical_line():
    plt.figure(figsize=(10,5))
    plt.xlabel("x values")
    plt.ylabel("y values")
    for i in range(1,10):
        plt.axvline(x=i,color="orange")
    plt.title("Demonstrating Multiple Vertical Lines")
    plt.show()
def main():
    vertical_line()
if __name__ == "__main__":
    main()
Output
Plot Multiple Vertical Lines Using vlines() Function
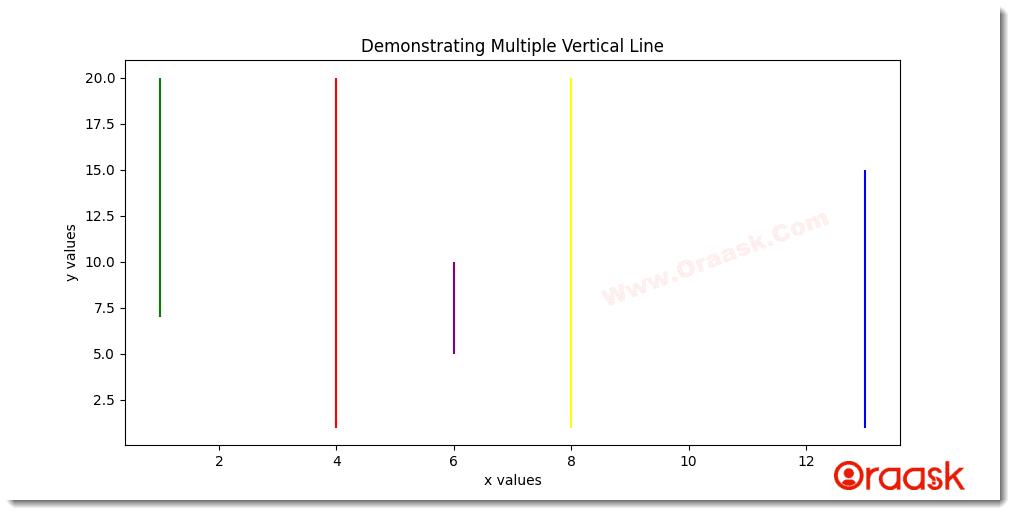
It’s clear from the name, which is shorthand for vertical lines that we use the vlines method to plot different vertical lines across the axes.
Example
import matplotlib.pyplot as plt
def vertical_line():
    plt.figure(figsize=(10,5))
    plt.xlabel("x values")
    plt.ylabel("y values")
    plt.vlines(x=1,color="green",ymin=7,ymax=20)
    plt.vlines(x=4,color="red",ymin=1,ymax=20)
    plt.vlines(x=6,color="purple",ymin=5,ymax=10)
    plt.vlines(x=8,color="yellow",ymin=1,ymax=20)
    plt.vlines(x=13,color="blue",ymin=1,ymax=15)
    plt.title("Demonstrating Multiple Vertical Line")
    plt.show()
def main():
    vertical_line()
if __name__ == "__main__":
    main()
Output
Plot Multiple Vertical Lines Using plot() Function
Example
import matplotlib.pyplot as plt
def vertical_line():
    plt.figure(figsize=(10,5))
    plt.xlabel("x values")
    plt.ylabel("y values")
    plt.plot((0,0),(1,5))
    plt.plot((1,1),(2,15))
    plt.plot((1,1),(2,5))
    plt.plot((2,2),(2,8))
    plt.plot((3,3),(3,9))
    plt.title("Demonstrating Multiple Vertical Line")
    plt.show()
def main():
    vertical_line()
if __name__ == "__main__":
    main()
Output
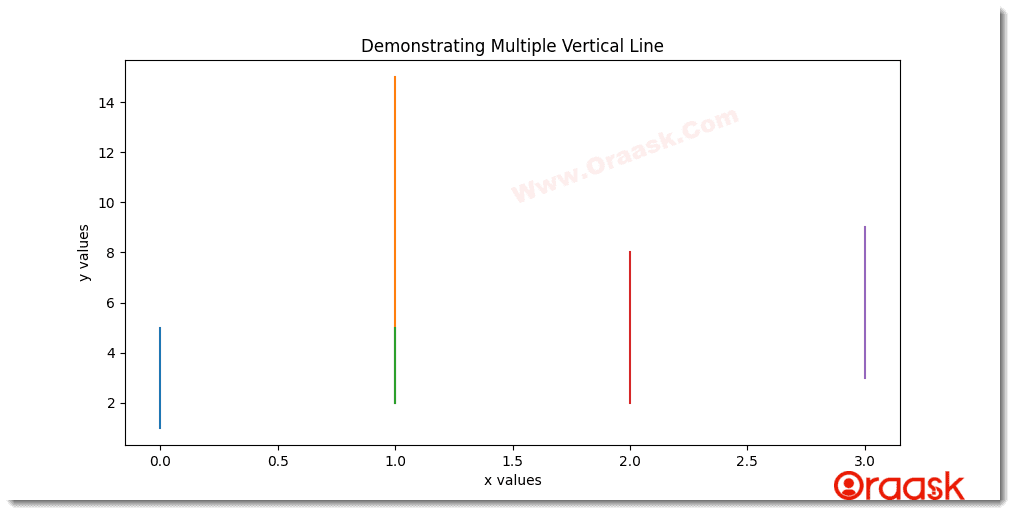
Note: We need not pass the color arguments to the plots to make them distinct. The plot function will automatically assign different values to each plot. This is one of the advantages of this function.
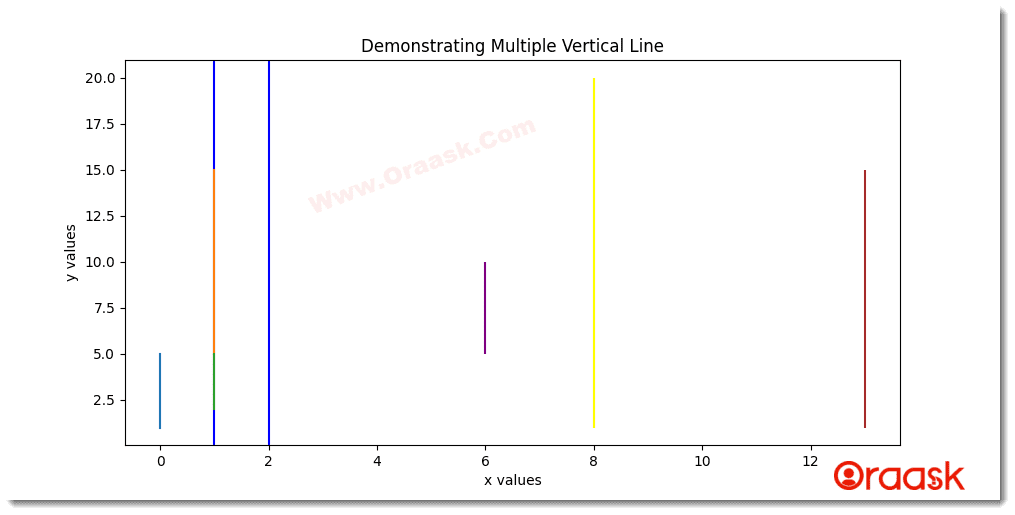
We can also use all the functions within the same code. This can be done as follows:
Example
import matplotlib.pyplot as plt
def vertical_line():
    plt.figure(figsize=(10,5))
    plt.xlabel("x values")
    plt.ylabel("y values")
    for i in range(1,3):
        plt.axvline(x=i,color="blue")
    plt.plot((0,0),(1,5))
    plt.plot((1,1),(2,15))
    plt.plot((1,1),(2,5))
    plt.vlines(x=6,color="purple",ymin=5,ymax=10)
    plt.vlines(x=8,color="yellow",ymin=1,ymax=20)
    plt.vlines(x=13,color="brown",ymin=1,ymax=15)
    plt.title("Demonstrating vertical line")
    plt.show()
def main():
    vertical_line()
if __name__ == "__main__":
    main()
Output
Final Thought:
In this article, we learned how to make vertical lines in matplotlib. We discussed majorly three functions called vines, plot, and axvline. The plot function will automatically assign different colors to the different plots. However, the other functions will assign similar colors to all the vertical lines.
The readers are encouraged to look at the python matplotlib documentation to explore more about the associated attributes and functions.


