How Can We Help?
Setting the views in python matplotlib three-dimensional plot is an important concept. Sometimes we may need to have a different view than what matplotlib offers us by default. This can be due to better visualization of the plots. Sometimes part of the figures are not visible from the default views of the three plots, so we try different angles to understand the plot better.
This article will teach us how to set the views in matplotlib 3D plots in python.
Prerequisite:
Before we proceed with the codes, we need a few prerequisites. We need to install a few libraries to go through the codes. They are numpy and matplotlib. If you haven’t installed the libraries, then follow these steps:
- If you are in windows, then open the PowerShell terminal. Type the following codes in the terminal:
pip install matplotlib
pip install numpy- If you are on Linux or macOS, then open the bash terminal and type the following codes:
pip install matplotlib
pip install numpy
After that, hit enters in either step.
view_int() Function:
The function used to change the view of the three-dimensional figures is python’s view_init() function. This function majorly takes two arguments in the code. The first one is the elevation angle of the plane concerning the z plane, and the second one is the azimuthal angle with the XY plane. The azimuthal angle is the angle between the view and the XY plane.
We can change the values of these two arguments in the codes and check the changes taking place in the program. First, we will learn how to use the function. After that, we will show some standard and frequently used views.
Example (1)
# Import all the necessary libraries in the code
import numpy as np
import matplotlib.pyplot as plt
# Creating user-defined function views
def views(elevation, azimuthal):
    # Creating the figure object in the code
    fig = plt.figure(figsize=(9, 9))
    # Creating the axes object in the code
    ax = plt.axes(projection='3d')
    # Creating data points for the z-axis
    z = np.linspace(0, 15, 1000)
    # Creating data points for the x-axis
    x = np.cos(z)
    # Creating data points for the y axis
    y = np.tan(z)
    # Plotting the graph
    ax.plot3D(x, y, z, 'green')
    # Setting the view angles
    ax.view_init(elevation, azimuthal)
    # Defining the title of the plot
    plt.title("Demonstrating the views in matplotlib")
    # Displaying the plot
    plt.show()
# Defining the main() function
def main():
    # Defining the elevation angle
    x = 34
    # Defining the azimuthal angle
    y = 56
    # Calling the views() function
    views(x, y)
# Calling the main() function
if __name__ == "__main__":
    main()
Output:
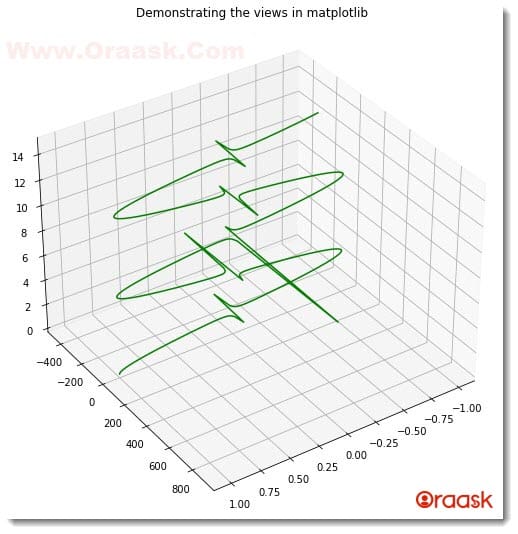
Explanation:
- First, we imported the numpy and the matplotlib library in the code using the python import statement. We used aliasing techniques to import for convenience in our code.
- Next, we created the views() function. This function takes two arguments, namely elevation and azimuthal. Under this function, we first created the figure object. We specified the size of the plot using the figsize attribute.
- Next, we created the axes object using the axes() function of python. We passed the attribute projection = “3d” to specify that we are dealing with the three-dimensional plots.
- Next, we create data points for the z, y, and x-axis. We used the linspace() function to create the data points. The linspace() function takes three basic arguments: start, end, and a number of elements. We use start to define the starting number from which the iteration should take place. The end defines the number up to which the iteration should run, and the last argument determines the number of elements that should be present in the array created.
- Now we plotted the graph using the plot3D() function. We also passed the color argument to set the color of the plot. We used the title() function to define the title of the plot and the show() function to display the plot. However, the show() function is optional in the Jupyter Notebook.
- After the view() function, we created the main() function, which is the main driving code of the program. Under this function, we defined the elevation and the azimuthal angles. We called the views() function and passed the required arguments.
- Finally, using the following lines of codes, we called the main() function:
if __name__ == “__main__”:
main()
More illustrations on views:
Since we have understood how to change the views, we should try different views and understand the properties better.
Let us understand how the change in views affects the visualization in the plot.
First, we have a look at the first view of a three-dimensional bar graph
Example (2)
# Import all the necessary libraries and modules
import numpy as np
import matplotlib.pyplot as plt
# create the main() function
def three_dimensional_bar(x, y, z, dx, dy, dz):
    # creating the figure class
    fig = plt.figure(figsize=(9,9))
    # Creating the three-dimensional axes
    ax = plt.axes(projection="3d")
    # Plotting the chart
    ax.bar3d(x, y, z, dx, dy, dz,color="purple")
    # Creating the label along the x-axis
    plt.xlabel("This is the label along x-axis")
    #Creating labels along the y axis
    plt.ylabel("This is the label along y-axis")
    # creating title to the chart
    plt.title("Demonstrating the three dimensional bar chart")
    # Displaying the graph
    plt.show()

def main():
    # Passing value for the x-axis
    x3 = [int(x) for x in range(1,11)]
    # Passing value for the y axis
    y3 = [51, 63, 17, 58, 29, 75, 86, 73, 78, 92]
    # Passing value for the z-axis
    z3 = [(2) for x in range(1,11)]
    # Setting the width along the x-axis
    dx = [(2) for x in range(1,11)]
    # Setting the width along the y axis
    dy = [(10) for x in range(1,11)]
    # Setting the width along the z-axis
    dz = [1, 2, 3, 4, 5, 6, 7, 8, 9, 10]
    three_dimensional_bar(x3,y3,z3,dx,dy,dz)

# Calling the main() function
if __name__ == "__main__":
    main()
Output:
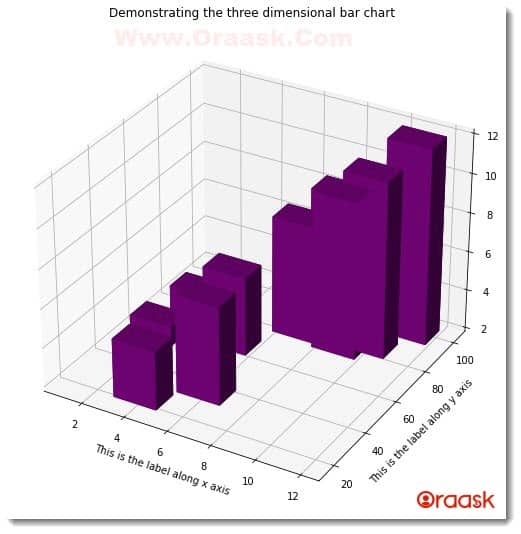
Now let us look at another view from the plane x=y=z.
Example (3)
# import all the necessary libraries and modules
import numpy as np
import matplotlib.pyplot as plt
# Create the main() function
def three_dimensional_bar(x, y, z, dx, dy ,dz, elevation, azimuthal):
    # creating the figure class
    fig = plt.figure(figsize=(9,9))
    # creating the three-dimensional axes
    ax = plt.axes(projection="3d")
    # Plotting the chart
    ax.bar3d(x, y, z, dx, dy, dz,color="purple")
    #creating the label along the x-axis
    plt.xlabel("This is the label along x-axis")
    # Creating labels along the y axis
    plt.ylabel("This is the label along y-axis")
    # Creating title to the chart
    plt.title("Demonstrating the three dimensional bar chart")
    # Setting the view angles
    ax.view_init(elevation, azimuthal)
    # Displaying the graph
    plt.show()
def main():
    # Passing value for the x-axis
    x3 = [int(x) for x in range(1,11)]
    # Passing value for the y axis
    y3 = [51, 63, 17, 58, 29, 75, 86, 73, 78, 92]
    # Passing value for the z-axis
    z3 = [(2) for x in range(1,11)]
    # Setting the width along the x-axis
    dx = [(2) for x in range(1,11)]
    # Setting the width along the y axis
    dy = [(10) for x in range(1,11)]
    # Setting the width along the z-axis
    dz = [1, 2, 3, 4, 5, 6, 7, 8, 9, 10]
    # Defining the elevation angle
    x = 45
    # Defining the azimuthal angle
    y = 145
    three_dimensional_bar(x3 , y3 , z3, dx, dy, dz, x, y)

# calling the main() function
if __name__ == "__main__":
    main()
Output:
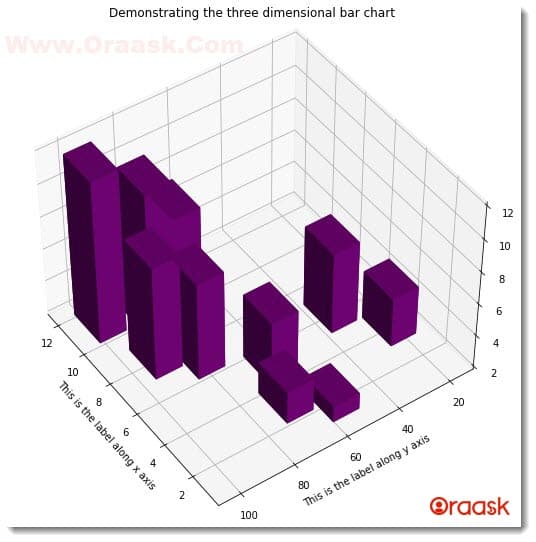
Notice that all the data points are the same. But we changed the view angle, and hence the looks of the graph changed.
Can the values of the arguments be negative? Yes, the arguments can also be negative. The negative angles indicate the view is in the opposite direction compared to the same angle with a positive sign.
Let us take one example.
Example (4)
# Import all the necessary modules and functions in the code
import numpy as np
import matplotlib.pyplot as plt
# Create a user-defined function named contour()
def view(x, y, z):
    # Next, create a figure object using the figure () function
    fig = plt.figure(figsize=(9, 9))
    # Creating the figure axes
    ax = plt.axes(projection='3d')
    # Plotting the graph.
    contour_graph = ax.contour3D(x, y, z, 100)
    # Defining the title of the plot
    plt.title("Contour graph")
    # Defining the x label
    ax.set_xlabel('This is the x axis')
    # Defining the y label
    ax.set_ylabel('This is the y axis')
    # Defining the z label
    ax.set_zlabel('This is the z axis')
    # Displaying the plot
    plt.show()
# Creating the main () function
def main():
    # Creating data points for the x-axis
    x = np.linspace(-100, 100, 2000)
    # Creating data points for the y axis
    y = np.linspace(-100, 100, 200)
    # Creating mesh grid out of the values of x and y
    x, y = np.meshgrid(x, y)
    # Creating data points for the z-axis
    z = np.power(x,2)+np.power(y,2)
    # Calling the contour () function
    view(x, y, z)
# Calling the main() function
if __name__ == "__main__":
    main()
Output:
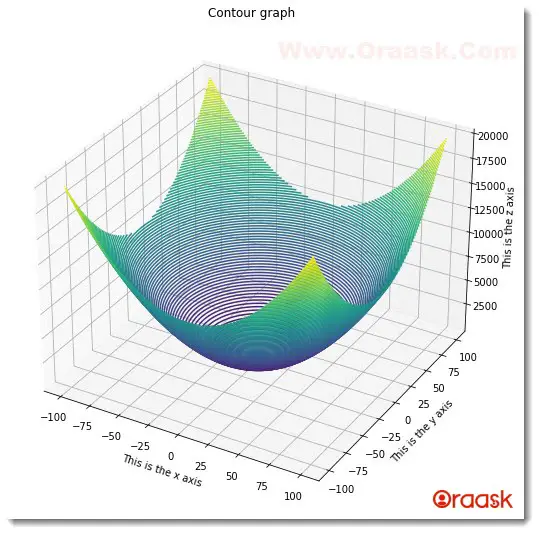
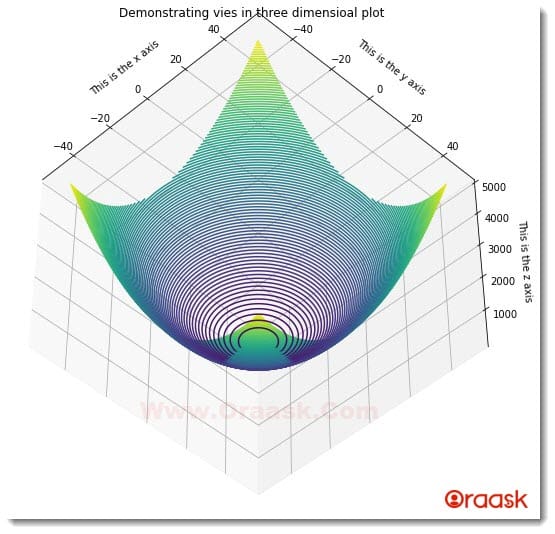
Now let us change the values of the view angles to -45 and -5. Hence, our view angle is -45 degrees with the “XY” plane and 45 degrees with the negative z-axis. Now try to visualize the figure in the view.
Example (5)
# Import all the necessary modules and functions in the code
import numpy as np
import matplotlib.pyplot as plt
# Create a user-defined function named contour()
def view(x, y, z):
    # Next, create a figure object using the figure () function
    fig = plt.figure(figsize=(9, 9))
    # Creating the figure axes
    ax = plt.axes(projection='3d')
    # Plotting the graph.
    contour_graph = ax.contour3D(x, y, z, 100)
    # Defining the title of the plot
    plt.title("Demonstrating vies in three dimensional plot")
    # Defining the x label
    ax.set_xlabel('This is the x axis')
    # Defining the y label
    ax.set_ylabel('This is the y axis')
    # Defining the z label
    ax.set_zlabel('This is the z axis')
    ax.view_init(-45,-45)
    # Displaying the plot
    plt.show()
# Creating the main () function
def main():
    # Creating data points for the x-axis
    x = np.linspace(-50, 50, 100)
    # Creating data points for the y axis
    y = np.linspace(-50, 50, 100)
    # Creating meshgrid out of the values of x and y
    x, y = np.meshgrid(x, y)
    # Creating data points for the z-axis
    z = np.power(x,2)+np.power(y,2)
    # Calling the contour () function
    view(x, y, z)
# Calling the main() function
if __name__ == "__main__":
    main()
Output:
Conclusion:
In this article, we have learned how to change the view angles in python matplotlib. We have used the view_init() function to change the angle of views. We learned that the function mainly takes two arguments elevation and azimuthal angles.
Although we covered the critical concepts in this code, we recommend the readers go through the python matplotlib documentation to understand the topic better. We also recommend the users try using different view angles to visualize better the change of the views with the given parameters.


